The Quest for HA and DR in Loki

According to the 2016 Ponemon Institute research, the average downtime cost is nearly $9,000 per minute. These downtimes not only cost money, but also hurt the competitive edge and brand reputation. The organization can prepare for downtime by identifying the root causes. For that, they need information on how the software and infrastructure is running. Many software programs help aggregate this information, and one of the popular and most used tools is Loki.
However, keeping Loki active under pressure is another problem. Recently, Our team was running the single monolith instance of Loki as a private logging solution for our application microservices rather than for observing Kubernetes clusters. The logs were stored in the EBS filesystem. We wanted our system to be more robust and resilient, so we implemented High Availability (HA) and Disaster Recovery (DR) for our microservice application.
But it was difficult due to the following reasons:
- Running clustered Loki is not possible with the file system store unless the file system is shared in some fashion (NFS, for example).
- Using shared file systems with Loki can lead to instability
- Shared file systems are prone to several issues, including inconsistent performance, locking problems, and increased risk of data corruption, especially under high load.
- Durability of the data depends solely on the file system’s reliability, which can be unpredictable.
Our team decided to use object stores like S3 or GCS. Object stores are specifically engineered for high durability and provide advanced behind-the-scenes mechanisms—such as automatic replication, versioning, and redundancy—to ensure your data remains safe and consistent, even in the face of failures or surges.
In this blog post, we will share how we achieved high availability (HA) and configured disaster recovery (DR) for Loki with AWS S3 as our object store. This ensures we can prevent or minimize data loss and business disruption from catastrophic events. First, let’s briefly discuss Loki and see what makes it different.
What is Loki, and how does it help with observability?
Loki is a horizontally-scalable, highly-available, multi-tenant log aggregation system inspired by Prometheus. Loki differs from Prometheus by focusing on logs instead of metrics, and collecting logs via push, instead of pull. It is designed to be very cost-effective and highly scalable. Unlike other logging systems, Loki does not index the contents of the logs but only indexes metadata about your logs as a set of labels for each log stream.
A log stream is a set of logs that share the same labels. Labels help Loki to find a log stream within your data store, so having a quality set of labels is key to efficient query execution.
Log data is then compressed and stored in chunks in an object store such as Amazon Simple Storage Service (S3) or Google Cloud Storage (GCS) or, for development or proof of concept, on the file system. A small index and highly compressed chunks simplify the operation and significantly lower Loki’s cost. Now, we can understand the Loki deployment modes.
Loki Deployment modes
Loki is a distributed system composed of multiple microservices, each responsible for specific tasks. These microservices can be deployed independently or together in a unique build mode where all services coexist within the same binary. Understanding the available deployment modes helps you decide how to structure these microservices to achieve optimal performance, scalability, and resilience in your environment. Different modes will impact how Loki’s components—like the Distributor, Ingester, Querier, and others—interact and how efficiently they manage logs.
The list of Loki microservices includes:
- Cache Generation Loader
- Compactor
- Distributor
- Index-gateway
- Ingester
- Ingester-Querier
- Overrides Exporter
- Querier
- Query-frontend
- Query-scheduler
- Ruler
- Table Manager (deprecated)
Different deployment modes
Loki offers different deployment modes, which allow us to build a highly available logging system. We need to choose the modes considering our log reads/writes rate, maintenance overhead, and complexity. Loki can be deployed in three modes, each suited for varying scales and complexity.
Monolithic mode: The monolithic mode is the simplest option, where all Loki’s microservices run within a single binary or Docker image under all targets. The target flag is used to specify which microservices will run on startup. This mode is ideal for getting started with Loki, as it can handle log volumes of up to approximately 20 GB/day. High availability can be achieved by running multiple instances of the monolithic setup.
Simple Scalable Deployment (SSD) mode: The Simple Scalable Deployment (SSD) mode is the preferred mode for most installations and is the default configuration when installing Loki via Helm charts. This mode balances simplicity and scalability by separating the execution paths into distinct targets: READ, WRITE, and BACKEND. These targets can be scaled independently based on business needs, allowing this deployment to handle up to a few terabytes of logs per day. The SSD mode requires a reverse proxy, such as Nginx, to route client API requests to the appropriate read or write nodes, and this setup is included by default in the Loki Helm chart.
Microservices Deployment mode: The microservices deployment mode is the most granular and scalable option, where each Loki component runs as a separate process specified by individual targets. While this mode offers the highest control over scaling and cluster management, it is also the most complex to configure and maintain. Therefore, microservices mode is recommended only for huge Loki clusters or operators requiring precise control over the infrastructure.
Achieving high availability (HA) in Loki
To achieve HA in Loki, we would:
- Configure multiple Loki instances using the
memberlist_configconfiguration. - Use a shared object store for logs, such as:
- AWS S3
- Google Cloud Storage
- Any self-hosted storage
- Set the
replication_factorto 3.
These steps help ensure your logging service remains resilient and responsive.
Memberlist Config
memberlist_config is a key configuration element for achieving high availability in distributed systems like Loki. It enables the discovery and communication between multiple Loki instances, allowing them to form a cluster. This configuration is essential for synchronizing the state of the ingesters and ensuring they can share information about data writes, which helps maintain consistency across your logging system.
In a high-availability setup, memberlist_config facilitates the dynamic management of instances, allowing the system to respond to failures and maintain service continuity. Other factors contributing to high availability include quorum, Write-Ahead Log (WAL), and replication factor.
Replication Factor, Quorum, and Write-Ahead Log (WAL)
-
Replication factor: Typically set to 3, the replication factor ensures that data is written to multiple ingesters (servers), preventing data loss during restarts or failures. Having multiple copies of the same data increases redundancy and reliability in your logging system.
-
Quorum: With a replication factor of 3, at least 2 out of 3 writes must succeed to avoid errors. This means the system can tolerate the loss of one ingester without losing any data. If two ingesters fail, however, the system will not be able to process writes successfully, thus emphasizing the importance of having a sufficient number of active ingesters to maintain availability.
-
Write-Ahead Log (WAL): The Write-Ahead Log provides an additional layer of protection against data loss by logging incoming writes to disk. This mechanism is enabled by default and ensures that even if an ingester crashes, the data can be recovered from the WAL. The combination of replication and WAL is crucial for maintaining data integrity, as it ensures that your data remains consistent and retrievable, even in the face of component failures.
We chose the Simple Scalable Deployment (SSD) mode as the default deployment method for running Loki instead of using multiple instances in monolithic mode for high availability. The SSD mode strikes a balance between ease of use and the ability to scale independently, making it an ideal choice for our needs. Additionally, we opted to use AWS S3 as the object store while running our application and Loki in AWS EKS services, which provides a robust and reliable infrastructure for our logging needs.
To streamline the setup process, refer to the Terraform example code snippet to create the required AWS resources, such as IAM roles, policies, and an S3 bucket with appropriate bucket policies. This code helps automate the provisioning of the necessary infrastructure, ensuring that you have a consistent and repeatable environment for running Loki with high availability.
Guide to install Loki
Following the guide, you can install Loki in Simple Scalable mode with AWS S3 as the object store. Below are the Helm chart values for reference, which you can customize based on your requirements.
# https://github.com/grafana/loki/blob/main/production/helm/loki/values.yaml
# Grafana loki parameters: https://grafana.com/docs/loki/latest/configure/

loki:
  storage_config:
    # using tsdb instead of boltdb
    tsdb_shipper:
      active_index_directory: /var/loki/tsdb-shipper-active
      cache_location: /var/loki/tsdb-shipper-cache
      cache_ttl: 72h # Can be increased for faster performance over longer query periods, uses more disk space
      shared_store: s3
  schemaConfig:
    configs:
      - from: 2020-10-24
        store: tsdb
        object_store: s3
        schema: v12
        index:
          prefix: index_
          period: 24h
  commonConfig:
    path_prefix: /var/loki
    replication_factor: 3
    ring:
      kvstore:
        store: memberlist
  storage:
    bucketNames:
      chunks: aws-s3-bucket-name
      ruler: aws-s3-bucket-name
    type: s3
    s3:
      # endpoint is required if we are using aws IAM user secret access id and key to connect to s3
      # endpoint: "s3.amazonaws.com"
      # Region of the bucket
      region: s3-bucket-region
To ensure the Loki pods are in the Running state, use the command kubectl get pods—n loki.
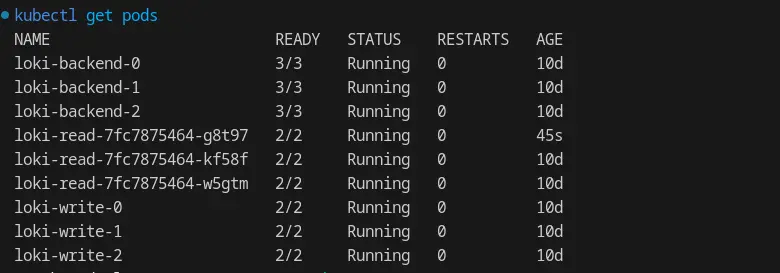
In this setup, we are running multiple replicas of Loki read, write, and backend pods.
With a replication_factor of 3, it is imperative to ensure that both the write and backend are operating with 3 replicas; otherwise, the quorum will fail, and Loki will be unavailable.
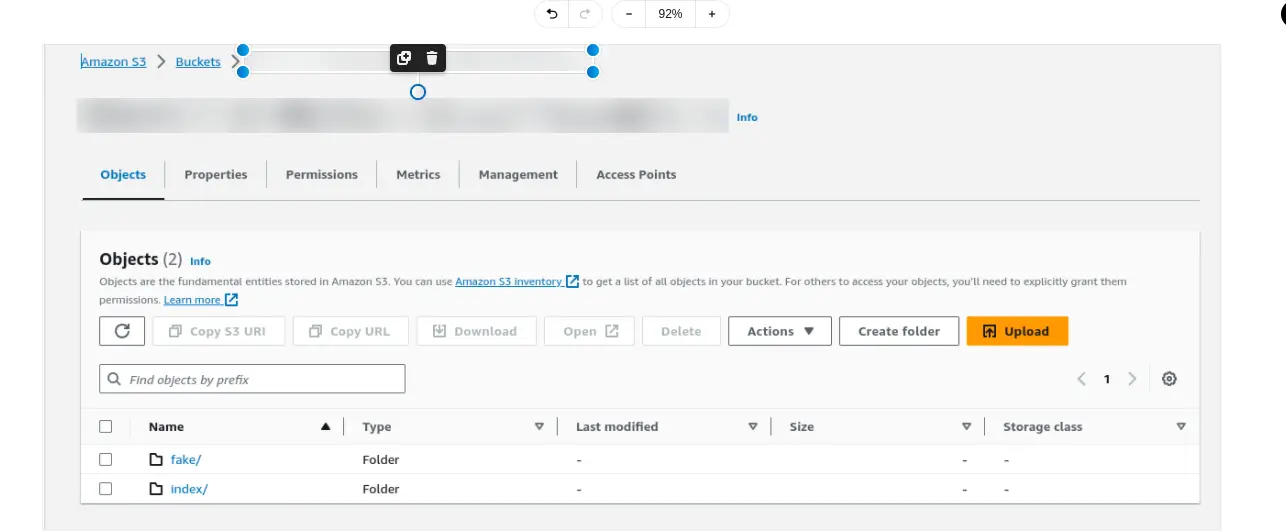
The following image illustrates Loki’s integration with Amazon S3 for log storage in a single-tenant environment. In this configuration, logs are organized into two primary folders within the S3 bucket: index and fake.
- Index folder: This folder contains the index files that allow Loki to efficiently query and retrieve log data. The index serves as a mapping of log entries, enabling fast search operations and optimizing the performance of log retrieval.
- Fake folder: This folder is used to store the actual log data. In a single-tenant setup, it may be labeled as “fake,” but it holds the important logs generated by your applications.
Now Loki is running with HA. Using logcli, we should also be able to verify the logs by querying against Loki instances.
Exploring approaches for disaster recovery
Loki is a critical component of our application stack, responsible for aggregating logs from multiple microservices and displaying them in the web application console for end-user access. These logs need to be retained for an extended period—up to 90 days.
As part of our disaster recovery (DR) strategy for the application stack, ensuring the availability and accessibility of logs during a disaster is crucial. If Region-1 becomes unavailable, the applications must continue to run and access logs seamlessly. To address this, we decided to implement high availability for Loki by running two instances in separate regions. If one Loki instance fails, the instance in the other region should continue to handle both read and write operations for the logs.
We explored three different approaches to setting up DR for Loki, intending to enable read and write capabilities across both Region-1 and Region-2, ensuring fault tolerance and uninterrupted log management.
Approach 1: Implementing S3 Cross-Region Replication
AWS S3 Cross-Region Replication (CRR) is a feature that allows you to automatically replicate objects from one S3 bucket to another bucket in a different AWS region. This is particularly useful for enhancing data durability, availability, and compliance by ensuring that your data is stored in multiple geographic locations. With CRR enabled, any new objects added to your source bucket are automatically replicated to the destination bucket, providing a backup in case of regional failures or disasters.
In Loki, setting up S3 CRR means that logs written to a single S3 bucket are automatically duplicated to another region. This setup ensures that logs are accessible even if one region encounters issues. However, when using multiple cross-region instances of Loki pointing to the same S3 bucket, there can be delays in log accessibility due to how Loki handles log flushing.
Flushing logs and configuration parameters
When logs are generated, Loki stores them in chunks, which are temporary data structures that hold log entries before they are flushed to the object store (in this case, S3). The flushing process is controlled by two critical parameters: max_chunk_age and chunk_idle_period.
-
The
max_chunk_ageparameter defines the maximum time a log stream can be buffered in memory before it is flushed to the object store. When this value is set to a lower threshold (less than 2 hours), Loki flushes chunks more frequently. This leads to higher storage input/output (I/O) activity but reduces memory usage because logs are stored in S3 more often. -
Conversely, if
max_chunk_ageis set to a higher value (greater than 2 hours), it results in less frequent flushing, which can lead to higher memory consumption. In this case, there is also an increased risk of data loss if an ingester (the component that processes and writes logs) fails before the buffered data is flushed.
-
The
chunk_idle_periodparameter determines how long Loki waits for new log entries in a stream before considering that stream idle and flushing the chunk. A lower value (less than 2 hours) can lead to the creation of too many small chunks, increasing the storage I/O demands. -
On the other hand, setting a higher value (greater than 2 hours) allows inactive streams to retain logs in memory longer, which can enhance retention but may lead to potential memory inefficiency if many streams become idle.
This example shows querying logs from one Loki instance, which is pointed to CRR-enabled S3 bucket.

Here we are querying the logs from another Loki instance which is also reading logs from the same CRR-enabled S3 bucket. You can observe the delay of ~2 hours in the logs retrieved.

With this approach, in the event of a disaster or failover in one region, there is a risk of losing up to 2 hours of log data. This potential data loss occurs because logs that have not yet been flushed from memory to the S3 bucket during that time frame may not be recoverable if the ingester fails.
Also, Cross-Region Replication is an asynchronous process, but the objects are eventually replicated. Most objects replicate within 15 minutes, but sometimes replication can take a couple of hours or more. Several factors affect replication time, including:
- The size of the objects to replicate.
- The number of objects to replicate.
For example, if Amazon S3 is replicating more than 3,500 objects per second, then there might be latency while the destination bucket scales up for the request rate. Therefore, we wanted real-time logs to be accessible from both instances of Loki running in different regions, so we decided against using AWS S3 Cross-Region Replication (CRR). This choice was made to minimize delays and ensure that logs could be retrieved promptly from both instances without the 2-hour latency associated with chunk flushing when using CRR. Instead, we focused on optimizing our setup to enable immediate log access across regions.
Approach 2: Utilizing the S3 Multi-Region Access Point
Amazon S3 Multi-Region Access Points (MRAP) offer a global endpoint for routing S3 request traffic across multiple AWS Regions, simplifying the architecture by eliminating complex networking setups. While Loki does not directly support MRAP endpoints, this feature can still enhance your logging solution. MRAP allows for centralized log management, improving performance by routing requests to the nearest S3 bucket, which reduces latency. It also boosts redundancy and reliability by rerouting traffic during regional outages, ensuring logs remain accessible. Additionally, MRAP can help minimize cross-region data transfer fees, making it a cost-effective option. However, at the time of this writing, there is a known bug that prevents Loki from effectively using this endpoint. Understanding MRAP can still be beneficial for future scalability and efficiency in your logging infrastructure.

Approach 3: Employing Vector as a Sidecar
We decided to use Vector, a lightweight and ultra-fast tool for building observability pipelines. With Vector, we could collect, transform, and route logs to AWS S3.
- So, our infrastructure is one S3 bucket and Loki per region.
- Vector will be running as a sidecar with the application pods.
- Since EKS clusters are connected via a transit gateway, we configured a private endpoint for both the Loki instances. We don’t want to expose it to the public as it contains application logs.
- Configured vector sources to read the application logs, transform and sink, and write to both the Loki instance.
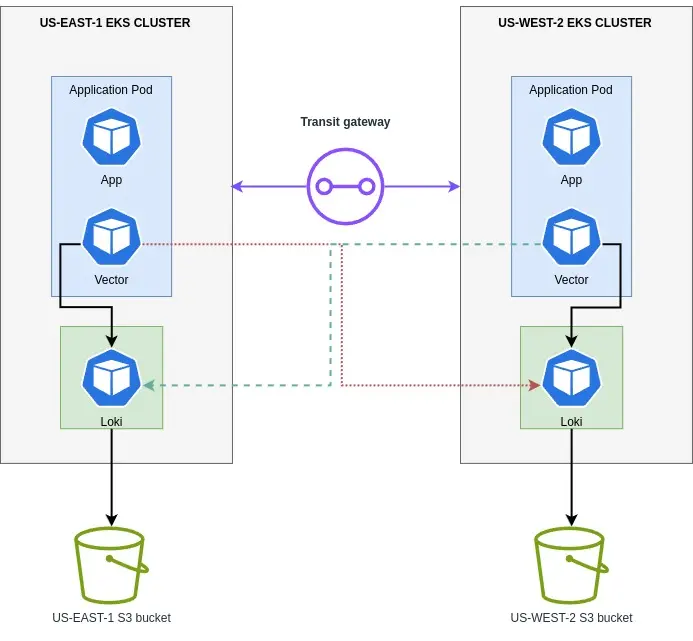
This way, all logs are ingested and available in both Loki and no need for cross-region replication and/or sharing the same bucket across many regions.
Vector configuration
Vector Remap Language (VRL) is an expression-oriented language designed for transforming observability data (logs and metrics) in a safe and performant manner.
- Sources collect or receive data from observability data sources into Vector.
- Transforms manipulate, or change that observability data as it passes through your topology.
- Sinks send data onward from Vector to external services or destinations.
data_dir: /vector-data-dir
sinks:
  # Write events to Loki in the same cluster
  loki_write:
    encoding:
      codec: json
    endpoint: http://loki-write.loki:3100
    inputs:
      - my_transform_id
    type: loki
  # Write events to Loki in the cross-region cluster
  loki_cross:
    encoding:
      codec: json
    endpoint: https://loki-write.aws-us-west-2.loki
    inputs:
      - my_transform_id
    type: loki
# Define the source to read log file
sources:
  my_source_id:
    type: file
    include:
      - /var/log/**/*.log
# Define the transform to parse syslog messages
transforms:
  my_transform_id:
    type: remap
    inputs:
      - my_source_id
    source: . = parse_json(.message)
In this setup, Vector collects logs from the /var/log/ directory and internal Vector logs. It parses as JSON, and replaces the entire event with the parsed JSON object and sends them to two Loki destinations (local and cross-region). The configuration ensures logs are sent in JSON format and can handle errors during log processing.
Conclusion
The journey to achieving high availability (HA) and disaster recovery (DR) for Loki has been challenging and enlightening. Through exploring various deployment modes and approaches, we’ve gained a deeper understanding of ensuring our logging system can withstand and recover from potential disruptions. The successful implementation of a Simple Scalable Mode with an S3 backend and the innovative use of Vector as a sidecar have fortified our system’s resilience and underscored the importance of proactive planning and continuous improvement in our infrastructure.
I hope you found this post informative and engaging. I’d love to hear your thoughts on this post; let’s connect and start a conversation on LinkedIn. Looking for help with Kubernetes? Do check out how we’re helping startups & enterprises as a Kubernetes consulting services provider.
Stay updated with latest in AI and Cloud Native tech
We hate 😖 spam as much as you do! You're in a safe company.
Only delivering solid AI & cloud native content.

