Is KeyDB 5x Faster than Redis? We Tested!
 Nagaraju Rapelli
  Sonali Srivastava
 The world is fast moving towards an on-demand economy. Whether it’s on-demand movies or on-demand food, customers expect everything to be on-demand and instant. To keep up with such demands, applications must be able to serve information and process transactions at the same speed and accuracy as a professional barista crafting a perfect shot of espresso.
In such a high-speed scenario, where speed is paramount, traditional databases fall short of expectations. Their inherent latency and limited throughput can be a bottleneck.
That’s where in-memory databases come in. They are the high-octane fuel that powers these lightning-fast applications. Thanks to their ability to store and process data entirely in main memory, they are becoming a preferred choice for building fast and responsive applications.
In this blog post, we’ll learn about InMem DB and benchmark Redis and KeyDB in different scenarios to determine which option is better for building an application powered by a fast in-memory database. Note: All experiments and comparisons in this article were conducted using Redis. On 20 March 2024, Redis transitioned to a closed-source project. However, the Redis fork - Valkey will offer the same results.
What is in-memory DB?
An in-memory database primarily stores and manages data in the system’s main memory (RAM), as opposed to traditional disk-based databases that rely on hard drives or solid-state drives (SSDs) for data storage. Here’s how in-memory databases work.
Features of in-memory DB
-
Data storage in RAM: Data is loaded and kept in the computer’s RAM significantly faster than saving it to disk storage. Data is organized in memory-optimized data structures, like hash tables or columnar formats, to facilitate rapid access.
-
Data retrieval: When a query or request is made, the in-memory database engine retrieves the required data directly from RAM. This process is nearly instantaneous, as there are no mechanical delays associated with disk I/O.
-
Data manipulation: In-memory databases enable real-time data manipulation and analysis. Complex queries, calculations, and analytics can be performed on in-memory data without the usual delays associated fetching data from disk.
-
Caching: In-memory databases often employ advanced caching mechanisms to minimize redundant data retrieval. Frequently accessed data is cached in RAM to reduce response times further.
-
Write operations: In-memory databases typically have mechanisms to ensure data persistence. While data is primarily kept in memory, it’s periodically written to disk for durability. This can be done through techniques like write-ahead logging or snapshotting.
-
High throughput: In-memory databases are designed for high throughput and low-latency operations, making them suitable for applications that require real-time data processing and analytics, such as financial trading systems, real-time monitoring, and decision support.
-
Scalability: In-memory databases can scale horizontally by adding more memory to the system, allowing them to handle larger datasets and more intensive workloads.
Choosing the right in-memory database
In-memory databases store data as key-value pairs. They are designed for applications where low-latency, high-throughput, and real-time data analysis are essential, such as gaming leaderboards or session stores. Further, they leverage the speed and efficiency of RAM to accelerate data access, retrieval, and processing.
We have plenty of open source tools available, including Redis, KeyDB, Dragonfly, Skytable, and many other cloud solutions that we can integrate with our applications to provide better performance or user experience.
With so many options, the question is which one to choose? Which of these can handle operations at such a large scale and provide better security, scaling, and maintainability in production setups? Below are a few considerations to help us choose a suitable in-memory database that should:
- Support high availability (HA).
- Have a fault tolerance mechanism.
- Be able to handle the high-traffic loads.
- Have monitoring capabilities.
- Have been battle tested and have enough community-based support.
Redis and KeyDB are the most mature and widely used, so we’ll focus on these two for the rest of the discussion. We will benchmark KeyDB and Redis to help us understand their performance behavior and replication speed.
Configuring Redis and KeyDB
To understand how Redis and KeyDB perform under various conditions, we decided to run various tests to benchmark their performance. Below is the hardware setup that we used to perform the benchmarking exercise.
Hardware Setup
| CPU | 112 cores |
| Memory | 1 TB RAM |
| Network | 50 Gbps |
| Disk | 1 TB |
We will use 3 servers for the abovementioned specifications in the coming setup.
Software Setup
To run benchmarking, we need some system pre-checks to be done for kernel parameters, which helps in Redis performance in a better way.
-
Make sure swap is turned off, to avoid slowing down Redis performance. Run the following command to check:
swapon -sThe above command should give an empty result. If we see any device, it indicates swap space is configured.
-
Create new file called 91-redis.conf under /etc/sysctl.d folder with the below values to allow max connections:
vm.overcommit_memory=1
net.core.somaxconn=65535
Restart the service using following command:
systemctl restart systemd-sysctl.service systemctl status systemd-sysctl.service -
Update memory transparent change to never.
echo never > /sys/kernel/mm/transparent_hugepage/enabled
Note: We observed that the system didn’t come up after rebooting, so we rolled back to always from never.
-
Update the
ulimitvalues for open file descriptors andnoprocvalues at the end of the file /etc/security/limits.conf#### Added while benchmarking Redis #### root soft nofile 1048576 root hard nofile 1048576 root soft noproc 65536 root hard noproc 65536Reboot the server once to make sure all the changes are reflected.
Configurations
Below is a high-level overview of the benchmarking process that we are going to perform:
- Set up the Memtier benchmarking tool
- Set up Redis in Multi-thread mode with Master-Replica replication and Redis Sentinel
- Set up KeyDB without a load balancer
- Compare their performance based on read-and-write operations
- Compare their performance based on replication testing
The obvious question is how we concluded the best way to compare Redis and KeyDB. The answer is using the Memtier benchmarking tool. So, let us configure Memtier, understand how we will use it, and then dig into the configuration of each database.
Memtier benchmarking tool
Memtier is a benchmarking tool for Redis and KeyDB performance and load testing. In the setup of this benchmarking database, we are running Memtier as a Docker container rather than installing it on the servers.
Memtier mainly focuses on SET (write) and GET (read) operations. It performs the test in a 1:9 ratio during the performance or load testing. This means out of 100 requests sent to the database servers, 10 will be set operations, and 90 will be get operations.
Let us understand the Memtier benchmarking command and its options to send requests to the database and perform testing:
docker run --rm docker.io:443/redislabs/memtier_benchmark \
  --host=<db_IP> -p <port>  \
  --requests=500 --clients=50 --threads=4 --data-size=512 --hide-histogram
In this command, Memtier is running as a Docker container. The request with the set and get operations will be sent to the database IP set in option --host on the port set in option -p. The total number of requests to send depends on options threads, clients, and requests.
In the above example, four threads will be created. Each thread will have 50 clients, each of which can send 500 requests to the databases. This means the total number of requests sent is 500 * 50 * 4 = 1,00,000—each of size 512 bytes.
Redis database
Redis is an open source in-memory database that can be used as a database, cache, streaming engine, message broker, and more. It offers high availability with Redis Sentinel, horizontal scalability with Redis cluster, and supports failover with replication.
Let us understand the Redis architecture setup to perform the benchmarking.
Architecture setup
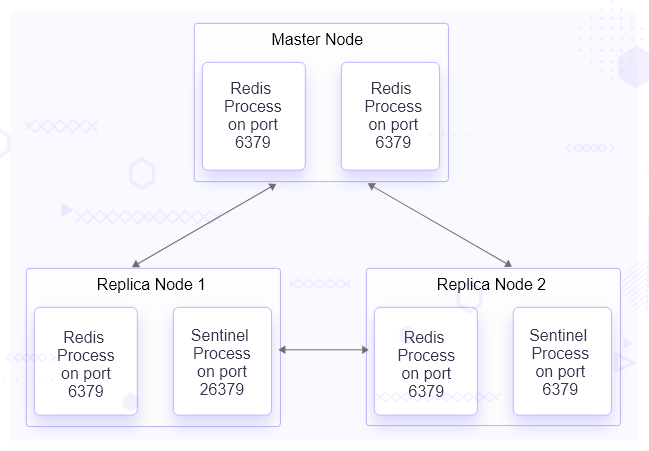
In this benchmarking setup, Redis stable release version 7.0.11 will be installed from the source on all three servers. Using the Master-Replica technique, we will configure one of the servers as the master node and the other two as the replica node.
We will configure Redis Sentinel on all these servers to ensure high availability. Sentinel will continuously monitor the master and replica nodes. In case the master is down, it will perform the failover and make one of the replicas as the master.
Once Redis is installed on these servers, it can be started using a built-in default configuration. Now, we must configure Redis to set up Master-Replica replication on the servers.
Configuring master node for replication
In the file predis.conf, update the following lines:
-
bind 127.0.0.1 -::1tobind *-:* -
protected-mode yestoprotected-mode no -
daemonize notodaemonize yes -
dir ./todir /opt/redis/data -
maxmemory <bytes>tomaxmemory 800gb
Keep the process path and port as default values since we have separate servers for the master and replica.
Save the configuration redis.conf and restart the redis-server process to apply the configuration using the following command.
./redis-server ./redis.conf
Configuring replica node for replication
In the redis.conf file, the same changes have been made as the master node configuration. Along with those changes, there is only one extra configuration.
-
replicaof <masterip> <masterport>toreplicaof 10.XX.XX.XX 6379
Here we are mentioning the IP of the master node and the port on which it will connect to replica. Please change the IP to match your setup. Save the configuration redis.conf and restart the redis-server process to apply the configuration.
These changes will be made to both the replica servers. Once the setup is ready, we will set up high availability using Redis Sentinel.
Configuring Redis Sentinel to monitor node availability
Redis Sentinel is required to monitor and notify the master and replica’s availability. If and when a master node goes down, Sentinel starts the failover process and upgrades a replica to the master. Redis Sentinel was installed when we installed the Redis Stack on each server. Here are the configurations that we have done for Redis Sentinel.
In the file sentinel.conf, make the following changes:
-
daemonize notodaemonize yes -
logfile "" tologfile “/opt/redis/logs/redis_sentinel.log”` -
sentinel monitor mymaster 127.0.0.1 6379 2tosentinel monitor mymaster 10.XX.XX.XX 6379 2
With the above changes, Redis Sentinel will run as a daemon, add logs to the mentioned path, and monitor the master node for which we have mentioned the IP.
Save the above configuration in sentinel.conf and run the sentinel process to apply the changes using the following command:
./redis-sentinel ./sentinel.conf
So far, we have set up replication and high availability in Redis. To configure Redis for performance, we need to understand threads, specifically single and multi-threaded Redis.
Configuring Redis in multi-threaded mode to serve requests parallel
In Redis single-threaded mode, the requests are served sequentially. This means that Redis will handle a single request at a given moment. Normally, Redis users use pipelining to speed up the Redis performances per core and spawn multiple instances to scale more. So far the configurations that we have done, Redis will operate in the single-threaded mode.
As per the Redis configuration, Redis introduced a multi-threaded mode where, using I/O threads, it is possible to speed Redis twice easily without resorting to pipelining or sharding the instance. So, for instance, if you have 4 core servers, try to use 2 or 3 I/O threads, and if you have 8 core servers, try to use 6 I/O threads and make the following changes to the configuration.
In the file redis.conf, update the following lines:
-
io-threads 4toio-threads 20 -
io-threads-do-reads notoio-threads-do-reads yes
Since we have 112 cores, we have enabled 20 I/O threads. We have also enabled threading of read requests with the above configuration. This will help us make use of the threads option with the Memtier utility during benchmarking.
We ran the Memtier benchmark utility and created a load for 60,00,000 requests on the single-threaded setup and then on the multi-threaded setup with a data size of 2MB. Here is the recorded result:
| Mode | Req sent | payload size | Processed req/s | Command(ops/sec) | Total time taken | avg | p99 |
|---|---|---|---|---|---|---|---|
| Single thread mode | 60,00,000 | 2048 kb | 6412 | set - 592 get - 5914 | 935 s | 44 ms | 634 ms |
| Multi thread mode | 60,00,000 | 2048 kb | 12051 | set - 1101 get - 11004 | 497 s | 64 ms | 868 ms |
In single-threaded mode, when 60,00,000 requests were sent with a data size of 2MB, 6412 requests were processed per second, of which 592 were set operations and 5914 were get operations. This Redis setup took 935s to process all the 60,00,000 requests with a p99 Latency of 634ms.
In multi-threaded mode, when 60,00,000 requests were sent with a data size of 2MB, 12051 requests were processed per second, of which 1101 were set operations and 11004 were get operations. This Redis setup took 497s to process all the 60,00,000 requests with a p99 Latency of 868ms.
Here is the graph showing the comparison between the above metrics.
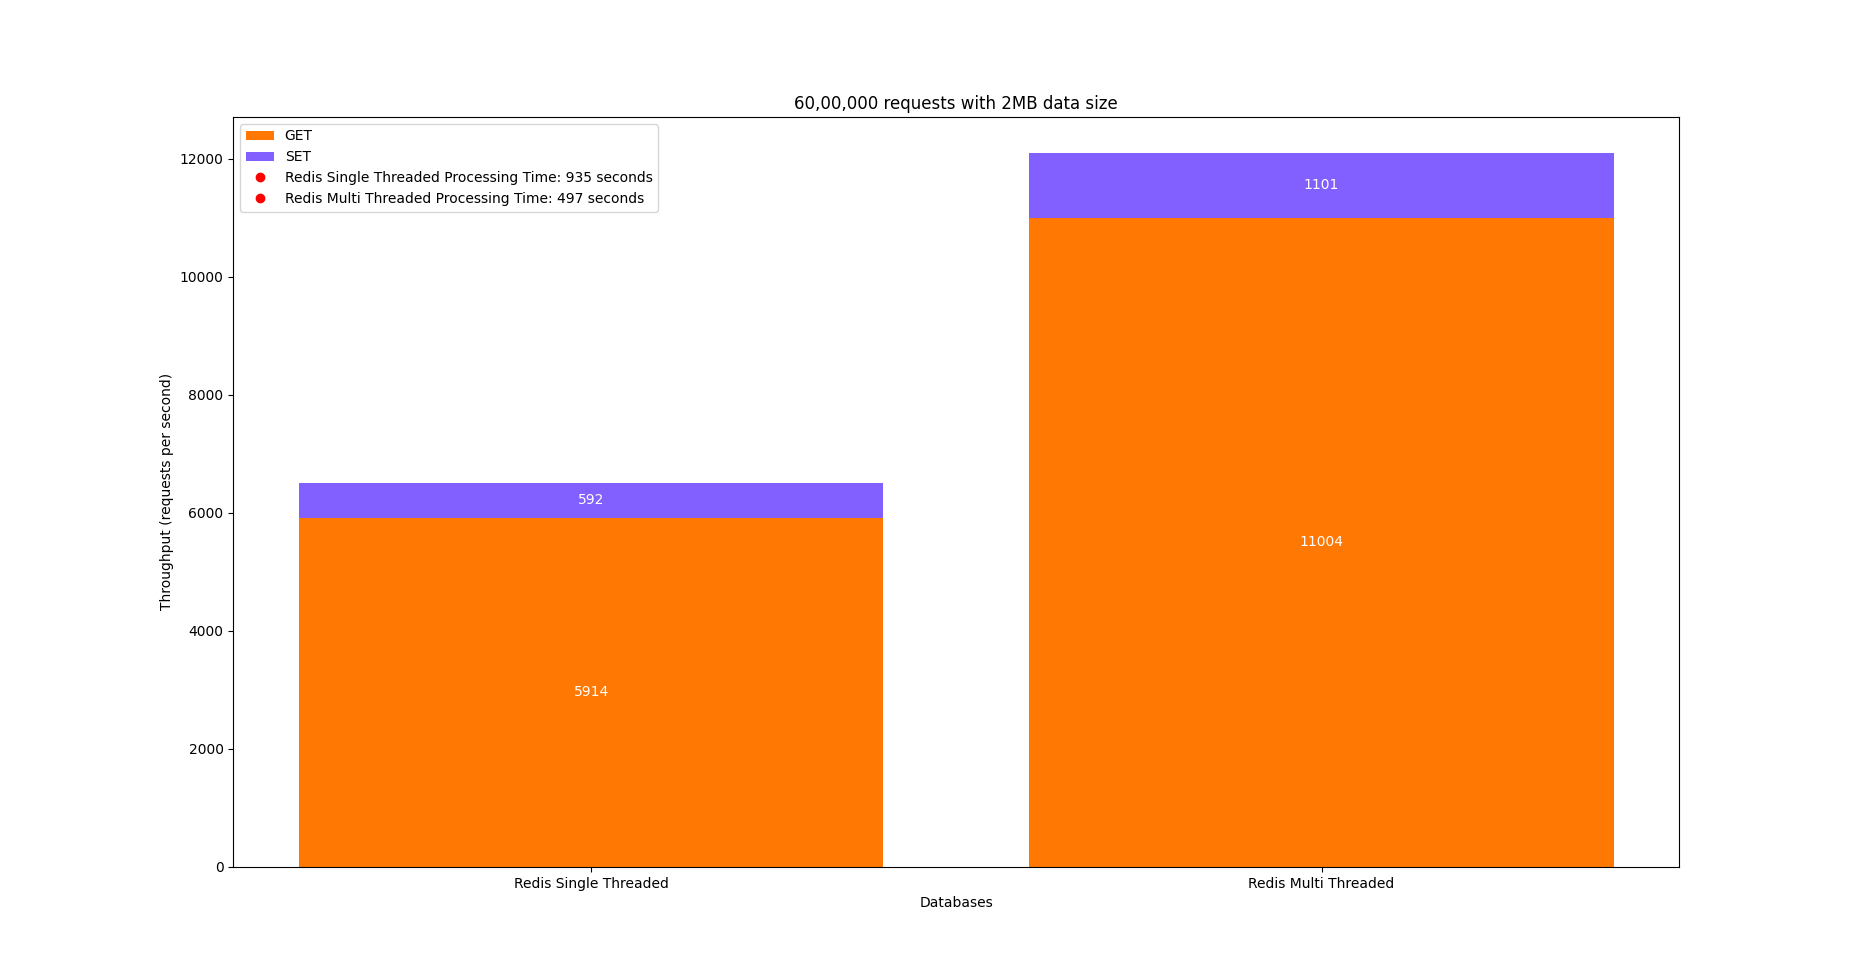
This indicates that Redis with a multi-threaded setup is faster, so we will use it to compare it with KeyDB.
KeyDB database
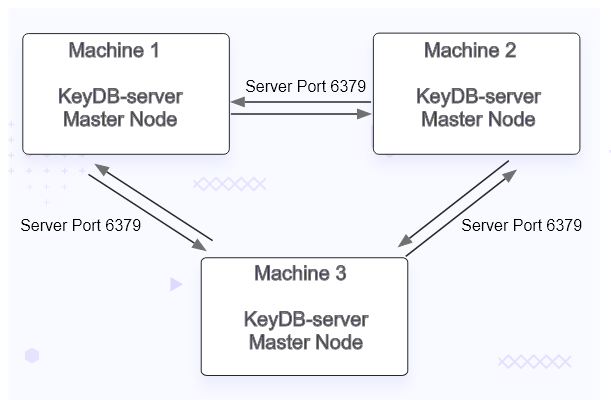
KeyDB is an open source database with features like high availability, low latency, high throughput, and much more. What sets it apart from Redis is the replication. While Redis offers Master-Replica replication, KeyDB offers multiple master replications. This means that there are no replica nodes. All the servers will be master nodes.
In KeyDB, you can run multiple master nodes replicated asynchronously to each other with a last-write-winning methodology. Refer to this blog to understand the process details. Now, let’s see the architecture setup and how to configure KeyDB on our servers.
Architecture setup
In this benchmarking setup, on all the 3 servers, KeyDB stable release version 6.3.3 will be installed using the rpm packages. Since all the nodes are master, we will enable active replication on these.
Configuring KeyDB
For configurations, the KeyDB config file is almost the same as redis.conf. Here are the changes that need to be done:
-
All changes made while configuring the Redis master node will be replicated in the KeyDB config.
-
KeyDB does not use io-threads, but io-threads is a config alias for server-threads.
server-threads 10 -
Set active replica to yes for failover setup. Here, the replica can also act as a master (similar to read-replica-allow-write yes in Redis)
active-replica yesSince all are master nodes, we need to enable active replication.
Save the configuration and restart the KeyDB process to apply the changes. We have not used a load balancer while configuring the KeyDB setup because KeyDB’s performance with and without the load balancer is almost the same. Read the TL;DR section for details related to it.
Benchmarking Redis and KeyDB performance
Like we ran the Memtier benchmark utility for Redis, in the same way, we will run multiple tests to compare the performance of KeyDB and Redis.
Benchmark: 60,00,000 requests with 2MB data size
We created a load for 60,00,000 requests on the KeyDB and Redis setup with a data size of 2MB. Here are the test parameters:
- requests=5000
- clients=300
- threads=4
Total number of requests: requestsclientsthreads = 50003004 = 60,00,000
Redis Behaviour
docker run --rm docker.io/redislabs/memtier_benchmark --host=[hostname] -p [port] --requests=5000 --clients=300 --threads=4 --data-size=2048 --hide-histogram

Writing results to stdout
RUN #1 Preparing benchmark client...
RUN #1 Launching threads now...
RUN #1 100%, 549 secs, 8 threads: 6000000 ops, 19559 (avg: 10913) ops/sec, 3.32GB/sec (avg: 1.89GB/sec), 59.74 (avg: 109.94) msec latency

4       Threads
300     Connections per thread
5000    Requests per Client


ALL STATS
=========================================================================================================================
Type            Ops/sec     Hits/sec    Misses/sec   Avg. Latency   p50 Latency   p99 Latency   p99.9 Latency   KB/sec
-------------------------------------------------------------------------------------------------------------------------
Sets            1089.474     0.00        0.00         567.17999      548.86380     1040.38300    1048.57500      2018981.25
Gets            10083.56     0.00        10083.56     29.62232        15.67980      251.93000     671.74300       392.84
Waits           0.00         0.00        0.00         0.00            0.00          0.00          0.00            0.00
-------------------------------------------------------------------------------------------------------------------------
Totals          11093.02     0.00        10083.56     60.93362       17.15180      880.63900     1032.19180      2019374.09
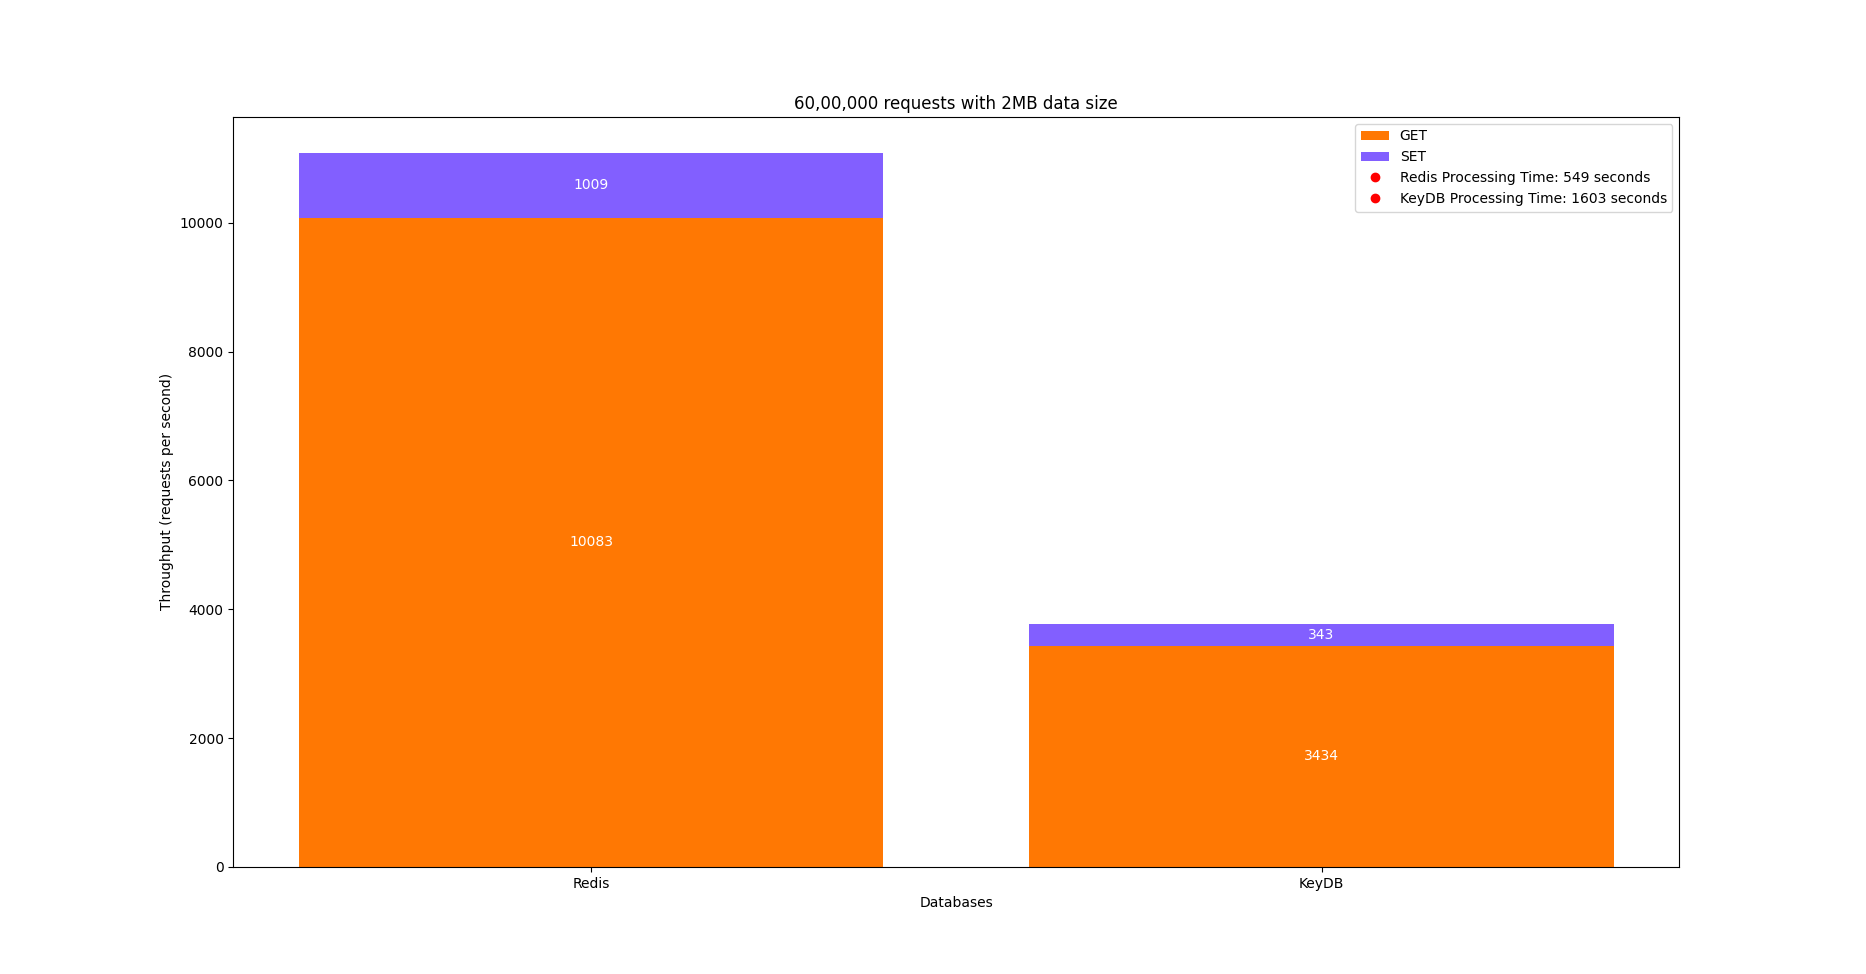
Here, when 60,00,000 requests were sent with a data size of 2MB, 11093 requests were processed per second out of which 1009 were SET operations and 10083 were GET operations. This Redis setup took 549s to process all the 60,00,000 requests with a p99.9 Latency of 1032ms.
KeyDB Behaviour
docker run --rm docker.io/redislabs/memtier_benchmark --host=[hostname] -p [port] --requests=5000 --clients=300 --threads=4 --data-size=2048000 --hide-histogram

Writing results to stdout
RUN #1 Preparing benchmark client...
RUN #1 Launching threads now...
RUN #1 63%, 1008 secs, 4 threads: 3776141 ops, 1109 (avg: 3743) ops/sec, 181.30MB/sec (avg: 664.91MB/sec), 433.32 (avg: 320.03) msec latency
RUN #1 100%, 1683 secs, 0 threads: 6000000 ops, 8607 (avg: 3741) ops/sec, 1.59GB/sec (avg: 665.10MB/sec), 137.85 (avg: 320.73) msec latency

4       Threads
300     Connections per thread
5000    Requests per Client


ALL STATS
=========================================================================================================================
Type            Ops/sec     Hits/sec    Misses/sec  Avg. Latency   p50 Latency   p99 Latency   p99.9 Latency   KB/sec
-------------------------------------------------------------------------------------------------------------------------
Sets            343.84      0.00        0.00        634.73590      712.70300     1040.57500    1040.57500      687706.03
Gets            3434.66     0.00        3434.66     45.98058       20.86300      802.81500     864.25500       133.81
Waits           0.00        0.00        0.00        0.00           0.00          0.00          0.00            0.00
-------------------------------------------------------------------------------------------------------------------------
Totals          3778.51     0.00        3434.66     46.17051       20.86300      802.81500     864.25500       687839.84
Here, when 60,00,000 requests were sent with a data size of 2MB, 3778 requests were processed per second out of which 343 were SET operations and 3434 were GET operations. This KeyDB setup took 1603s to process all the 60,00,000 requests with a p99.9 Latency of 864ms.
Here is the graph showing the comparison between the above metrics.
Benchmark: 10,00,000 requests with 1024KB data size
We created a load for 10,00,000 requests on the KeyDB and Redis setup with a data size of 1024KB. Here are the test parameters:
- requests=670
- clients=300
- threads=5
Redis Behaviour
docker run --rm docker.io/redislabs/memtier_benchmark --host=[hostname] -p [port] --requests=670 --clients=300 --threads=5 --data-size=1024000 --hide-histogram
Writing results to stdout
RUN #1 Preparing benchmark client...
RUN #1 Launching threads now...
RUN #1 100%, 46 secs, 0 threads: 1085000 ops, 29617 (avg: 21767) ops/sec, 2.76GB/sec (avg: 1.89GB/sec), 54.67 (avg: 68.90) msec latencyyy

5        Threads
300      Connections per thread
670      Requests per Client


ALL STATS
=========================================================================================================================
Type            Ops/sec     Hits/sec    Misses/sec  Avg. Latency   p50 Latency   p99 Latency   p99.9 Latency   KB/sec
--------------------------------------------------------------------------------------------------------------------------
Sets            1957.00      0.00        0.00         499.43963      491.51900     1023.99900    1048.57500      1957096.00
Gets            19537.89     0.00        19537.89     22.46585       11.64700      218.11100     475.13500       761.32
Waits           0.00         0.00        0.00         0.00           0.00          0.00          0.00            0.00
-------------------------------------------------------------------------------------------------------------------------
Totals          21494.89     0.00        19537.89     63.96185       13.18300      827.39100     1019.90300      1957857.32
Here, when 10,00,000 requests were sent with a data size of 1024KB, 21494 requests were processed per second out of which 1957 were SET operations and 19537 were GET operations. This Redis setup took 46s to process all the 10,00,000 requests with a p99 Latency of 827ms.
KeyDB Behaviour
docker run --rm docker.io/redislabs/memtier_benchmark --host=[hostname] -p [port] --requests=670 --clients=300 --threads=5 --data-size=1024000 --hide-histogram

Writing results to stdout
RUN #1 Preparing benchmark client...
RUN #1 Launching threads now...
RUN #1 100%, 119 secs, 0 threads: 1085000 ops, 29789 (avg: 8433) ops/sec, 2.55GB/sec (avg: 750.17MB/sec), 93.26 (avg: 177.84) msec latencycyy

5        Threads
300      Connections per thread
670      Requests per Client


ALL STATS
=========================================================================================================================
Type            Ops/sec     Hits/sec    Misses/sec  Avg. Latency   p50 Latency   p99 Latency   p99.9 Latency   KB/sec
-------------------------------------------------------------------------------------------------------------------------
Sets            789.41      0.00        0.00        748.31211      741.37500     1040.38300    1048.57500      789451.83
Gets            7881.18     0.00        7881.18     45.25478       20.09500      794.62300     860.15900       307.10
Waits           0.00        0.00        0.00        0.00           0.00          0.00          0.00            0.00
------------------------------------------------------------------------------------------------------------------------
Totals          8670.59     0.00        7881.18     63.21797       20.47900      839.67900     1015.80700      789758.93
Here, when 10,00,000 requests were sent with a data size of 1024KB, 8670 requests were processed per second, 789 of which were SET operations and 7881 of which were GET operations. This KeyDB setup took 119s to process all the 10,00,000 requests with a p99 Latency of 839ms.
Here is the graph showing the comparison between the above metrics.

Observations from the above benchmarks
We set up Grafana on the servers to observe the CPU and Network I/O utilization by KeyDB and Redis while performing the above benchmarks.
CPU
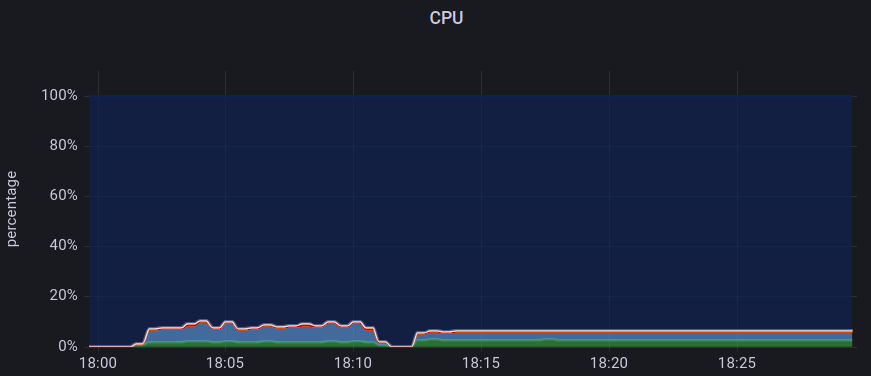
In the above graph, we have plotted the CPU utilization percentage for KeyDB and Redis. The graph from 18:00 to 18:10 is for KeyDB, and from 18:10 to 18:25 is for Redis. The graph indicates that CPU utilization was continuously fluctuating for KeyDB while it was consistent for Redis when we sent requests using the Memtier benchmarking utility.
Network I/O
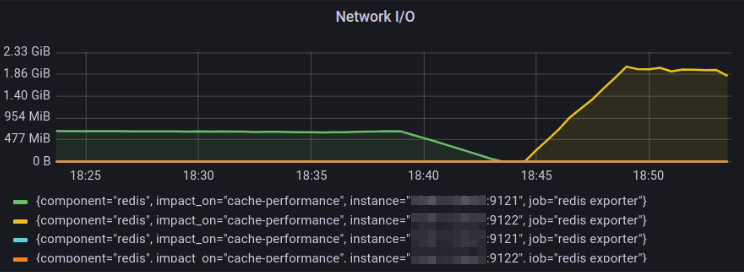
In this graph, we plotted the Network I/O for the KeyDB from 18:25 - 18:40 and Redis from 18:45 - 18:55 timestamp for the SET operations. The Network I/O utilization is 2GiB/s for Redis, whereas KeyDB has 530MiB/s utilization only. The graph indicates that Redis properly utilized the available resources.
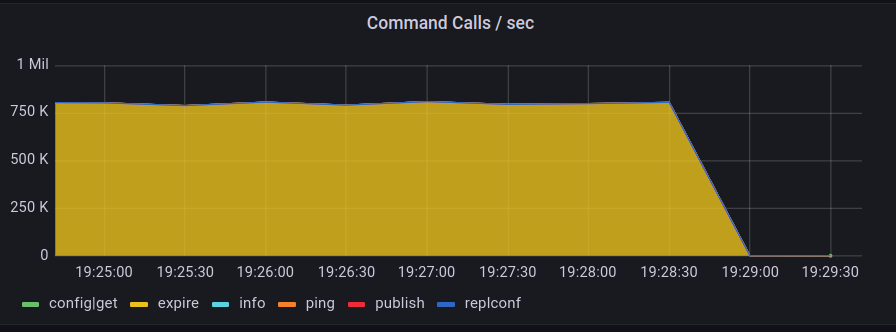
Commands Executed per second
The SET and GET operations request is executed as a command.
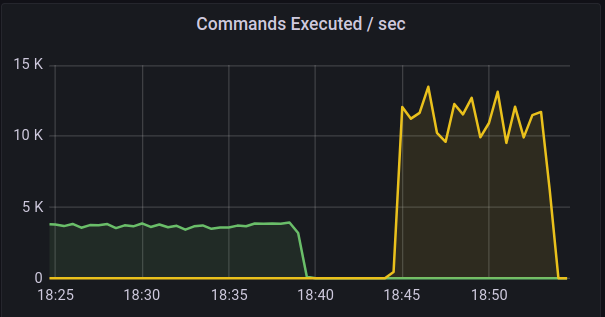
In the graph above, we have plotted the commands executed per second for the KeyDB from 18:25 - 18:40 and for Redis from 18:45 - 18:55 timestamp. When requests were sent using the Memtier utility, for KeyDB, only ~4K commands were executed per second, while for Redis setup, ~12K commands were executed per second.
Replication testing and comparison
Both Redis and KeyDB use asynchronous replication by default, which has low latency and high performance. So, we decided to test replication time by loading data into Redis and KeyDB.
We used a 4GB file with ~547 million records and uploaded it on the Redis multi-threaded and KeyDB setup. This would internally invoke the SET operations requests command. Here are the results and observations for each.
Redis
File: sample_data.tar.gz
Records received: 547493834
Records inserted: 537493834
Total time: 14 minutes (847 seconds)
The time taken to upload ~547 million records is 14 minutes.
To upload such huge data, ~750K SET command calls were made per second by Redis.
KeyDB
File: sample_data.tar.gz
Records received: 547493834
Records inserted: 537493834
Total time: 18 minutes (1137 seconds)
The time taken to upload ~547 million records is 18 minutes.
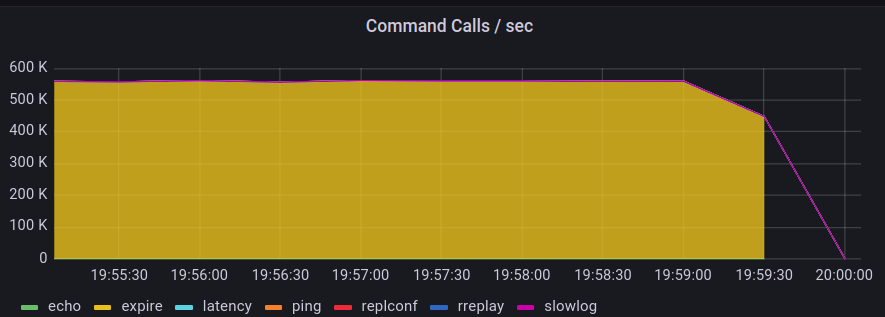
To upload such huge data, ~500K SET command calls were made per second by KeyDB.
Inference
Based on the test results, benchmarking results conclude that Redis multi-thread is good to set up in environments. KeyDB terminology “We are 5X faster than Redis” was not met throughout our testing. Here are our test conclusions:
-
When we sent 10,00,000 requests for performance testing, Redis performed better in multi-threaded mode than KeyDB. Redis setup took 46s to process all the requests, while KeyDB took 119s.
-
When we sent 60,00,000 requests for performance testing, Redis in multi-threaded mode again performed better than KeyDB. Redis setup took 549s to process all the requests, while KeyDB took 1603s.
-
When we tried uploading ~547 million records for replication testing, Redis took 14 minutes, while KeyDB took 18 minutes.
Efficiently using KeyDB with Load balancer
We have seen that most Redis multi-thread operations are superfast, but we were under the assumption that we are not using KeyDB efficiently. KeyDB has 3 master nodes, and through our benchmarking, we are sending traffic to a single node and ignoring the other nodes.
A question has been raised against this KeyDB testing, where we discussed: Can KeyDB work better if we add a load balancer in front of all nodes and start sending traffic? To do so, we will set up KeyDB with load balancer and compare the performance and replication against the KeyDB setup without load balancer.
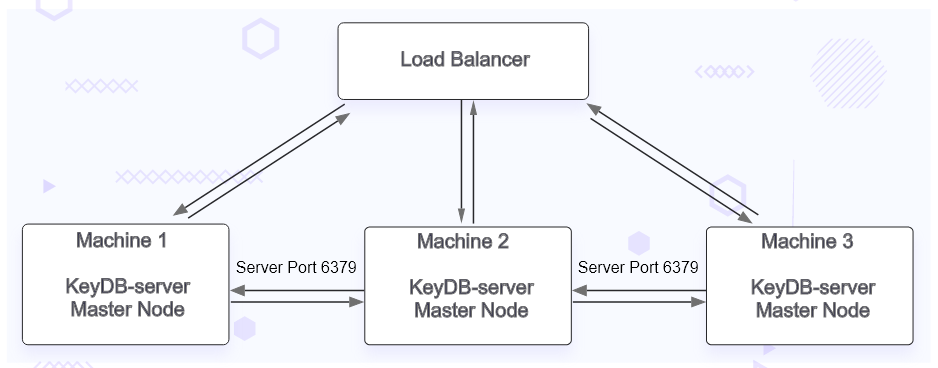
KeyDB with load balancer architecture
On a container on one of the servers, we set up HAProxy to load balance all the master nodes of the KeyDB.
Performance benchmarking
We created a load for 10,00,000 requests on the KeyDB with load balancer setup with a data size of 512kb. Here are the test parameters:
- requests=670
- clients=300
- threads=5
Performance result
KeyDB with load balancer
docker run --rm docker.io/redislabs/memtier_benchmark --host=[hostname] -p [port] --requests=670 --clients=300 --threads=5 --data-size=512000 --hide-histogram

Writing results to stdout
RUN #1 Preparing benchmark client...
RUN #1 Launching threads now...
RUN #1 100%, 29 secs, 0 threads: 1005000 ops, 42583 (avg: 33599) ops/sec, 1.61GB/sec (avg: 1.46GB/sec), 39.72 (avg: 44.64) msec latency

5        Threads
300      Connections per thread
670      Requests per Client


ALL STATS
==========================================================================================================================
Type            Ops/sec     Hits/sec    Misses/sec   Avg. Latency   p50 Latency   p99 Latency   p99.9 Latency   KB/sec
--------------------------------------------------------------------------------------------------------------------------
Sets            3232.55     0.00        0.00         312.64214      264.19100     618.49500     761.85500       1616437.20
Gets            32272.55    0.00        32272.55     17.77748       14.20700      97.79100      133.11900       1257.54
Waits           0.00        0.00        0.00         0.00           0.00          0.00          0.00            0.00
--------------------------------------------------------------------------------------------------------------------------
Totals          35505.10    0.00        32272.55     44.61937       14.65500      522.23900     614.39900       1617694.74
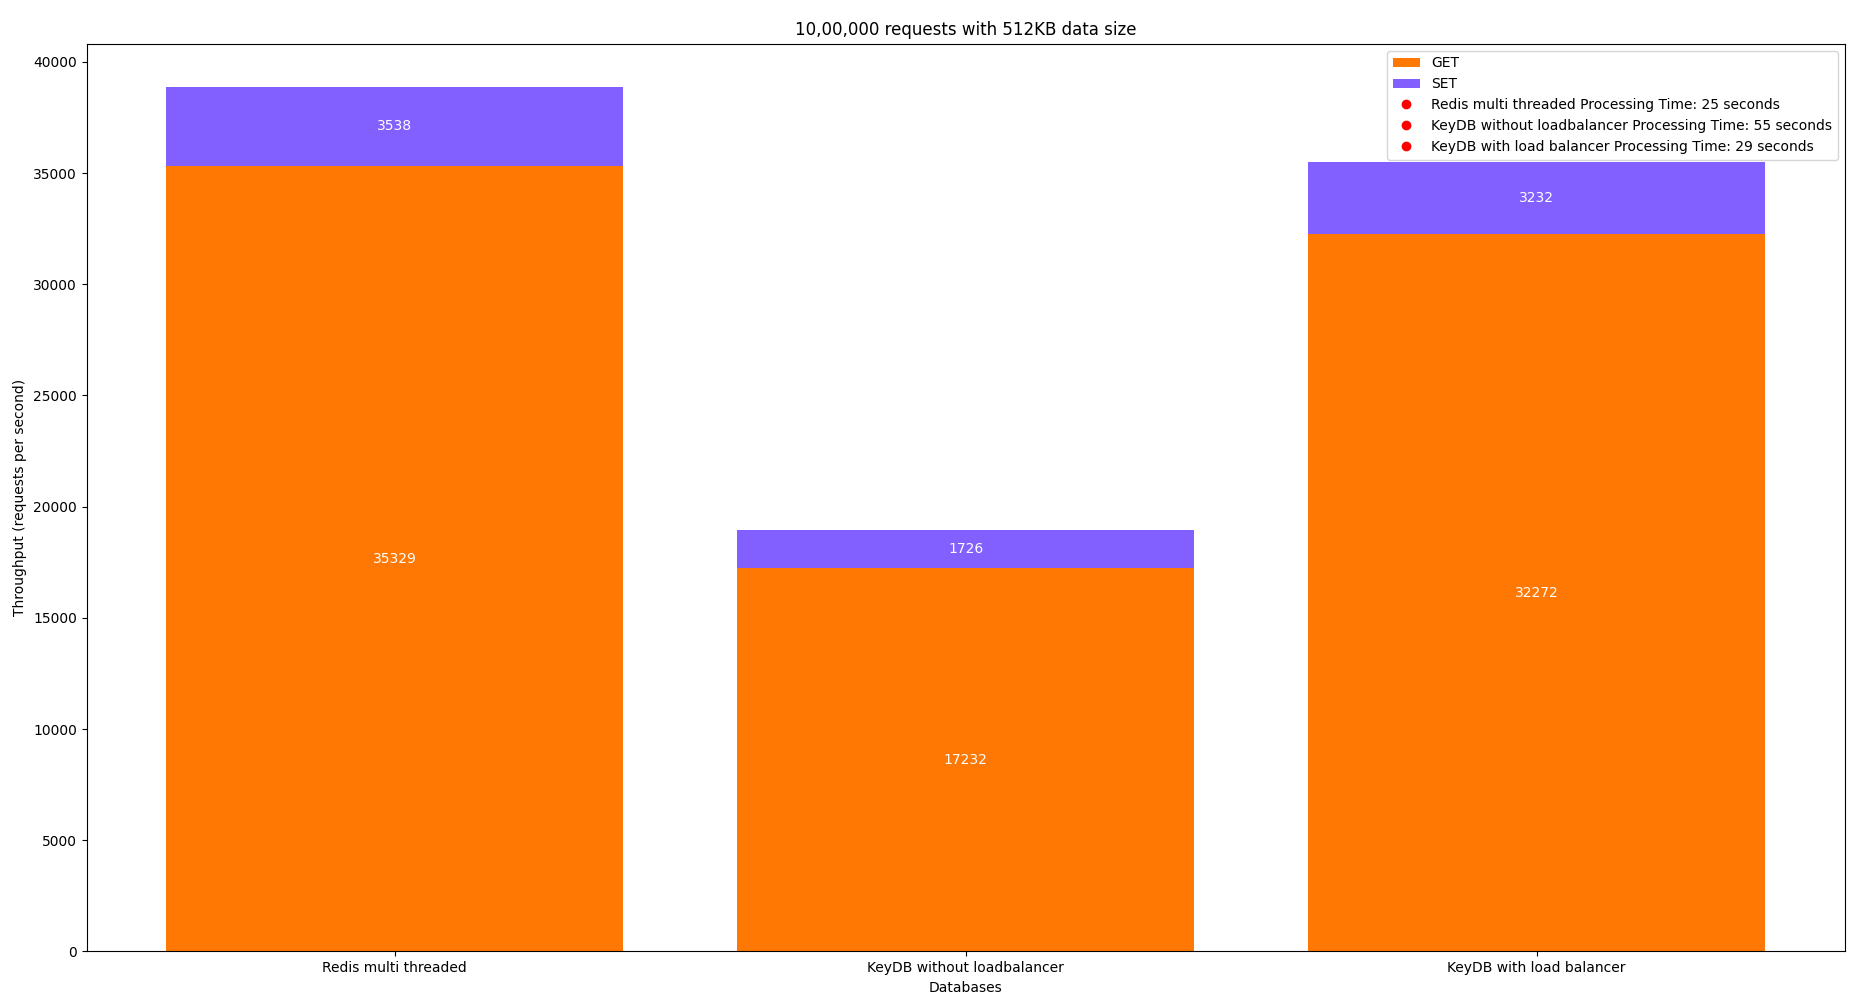
When 10,00,000 requests were sent with a data size of 512KB, 35505 requests were processed per second, of which 3232 were SET operations and 32272 were GET operations. This KeyDB setup took 29s to process all the 10,00,000 requests with a p99 Latency of 522ms.
Let us compare the performance with the KeyDB without a load balancer and Redis multi-threaded for the same performance benchmarking.
KeyDB without loadbalancer
docker run --rm [REDACTED] redislabs/memtier_benchmark --host=[hostname] -p [port] --requests=670 --clients=300 --threads=5 --data-size=512000 --hide-histogram
Writing results to stdout
ALL Prepared benchmark client...
RUN #1 Launching threads now...
RUN #1 100%, 55 secs) 0 threads: 1085000 ops, 35514 (avg: 18043) ops/sec, 1.51GB/sec (avg: 802.84MB/sec), 59.52 (avg: 83.12) msec latency

5   Threads
300 Connections per thread
670   Requests per client

ALL STATS
=============================================================================================================================
Type        Ops/sec     Hits/sec        Misses/sec      Avg. Latency   p50 Latency   p99 Latency     p99.9 Latency   KB/sec
-----------------------------------------------------------------------------------------------------------------------------
Sets         1726.11    0.00            0.00            366.62831      294.91100     1036.28700      1048.57500      863141.68
Gets         17232.83   0.00            1723.83         28.67437       12.03100      741.37500       790.52700       671.50
Waits        00.00      00.00           0.00            0.00000        0.00000       0.00000         0.00000         0.00
-----------------------------------------------------------------------------------------------------------------------------
Totals       18958.94   0.00            1723.83         51.17788       12.73500      757.75900       1028.09500      863813.17
Here, when 10,00,000 requests were sent with a data size of 512KB, 18958 requests were processed per second out of which 1726 were SET operations and 17232 were GET operations. This KeyDB setup took 55s to process all the 10,00,000 requests with a p99 Latency of 757ms.
Redis multi threaded
docker run --rm docker.io/redislabs/memtier_benchmark --host=[hostname] -p [port] --requests=670 --clients=300 --threads=5 --data-size=51200 --hide-histogram

Writing results to stdout
ALL Preparing benchmark client...
RUN #1 Launching threads now...
RUN #1 100%, 25 secs) 0 threads: 1050000 ops, 49612 (avg: 38858) ops/sec, 2.22GB/sec (avg: 1.69GB/sec), 33.90 (avg: 38.59) msec latency

5   Threads
300 Connections per thread
670 Requests per client

ALL STATS
===========================================================================================================================
Type        Ops/sec     Hits/sec    Misses/sec  Avg. Latency    p50 Latency     p99 Latency     p99.9 Latency   KB/sec
---------------------------------------------------------------------------------------------------------------------------
Sets         3538.70    0.00        0.00        314.04160       315.39100       638.97500       700.41500       1769752.21
Gets         35329.99   0.00        35329.92    11.80561        4.86300         67.58300        181.24700       1376.60
Waits        0.00       0.00        0.00        0.00000         0.00000         0.00000         0.00000         0.00
---------------------------------------------------------------------------------------------------------------------------
Totals       38868.72   0.00        35329.92    38.59546        5.47100         471.03900       634.87900       1770948.89
Here, when 10,00,000 requests were sent with a data size of 512KB, 38868 requests were processed per second, 3538 of which were SET operations and 35329 of which were GET operations. This setup took 25s to process all the 10,00,000 requests with a p99 Latency of 471ms.
Here is the graph showing the comparison between the above metrics.
Replication benchmarking result
Let us upload ~547 million records to check the time it takes to complete the operation.
File: sample_data.tar.gz
Records received: 547493834
Records inserted: 537493834
Total time: 19 minutes (1150 seconds)
We have gotten almost the same result, and the observable point here is that all set operations are pointed to a single node. The KeyDB setup with loadbalancer took ~19 minutes.
This might be because the redis-cli command is created as a single client, and all the bulk operations happen on the same connections. That’s why it didn’t go round robin / utilize all the nodes to distribute the set operation workload.
Inference
We have seen that between KeyDB with and without a load balancer, a 50% improvement is seen in the performance of KeyDB, but that is still not better than the performance of Redis in multi-threaded mode. Redis took 25s while KeyDB with load balancer took 29s to process 10,00,000 requests of 512KB data size.
Similarly, we performed many more such tests using Memtier and recorded the following results for SET and GET commands.
SET command
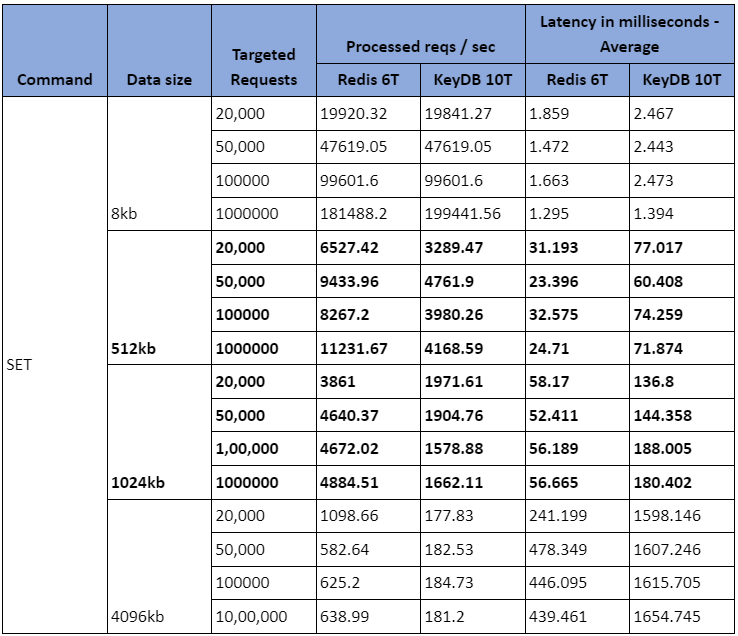
Let us pick one row and understand in the above table the behavior of Redis with 6 threads and KeyDB with 10 threads to process SET commands.
When the 1024kb data size of 20,000 requests were sent:
- 3861 requests were processed per second by Redis set up with 6 threads with an average latency of 58 milliseconds.
- 1971 requests were processed per second by KeyDB set up with 10 threads with an average latency of 136 milliseconds.
GET command
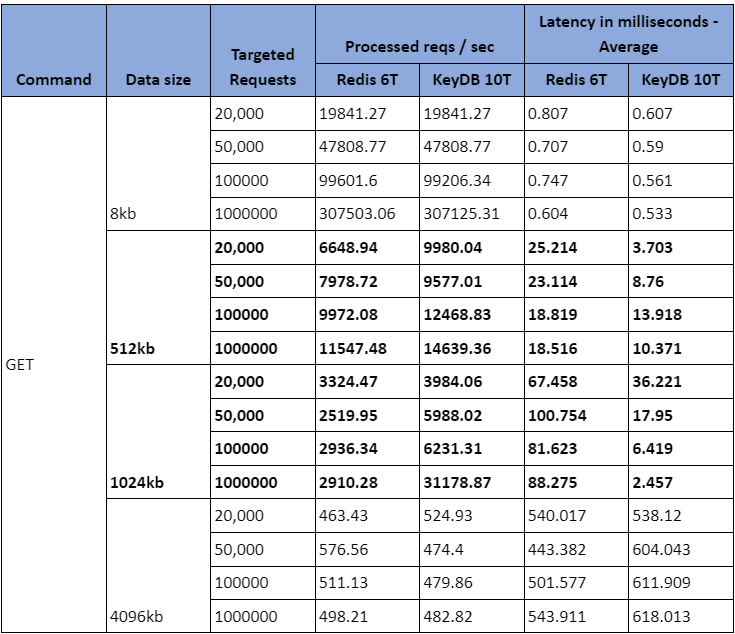
Let us pick one row and understand in the above table the behavior of Redis with 6 threads and KeyDB with 10 threads to process GET commands.
When the 1024kb data size of 20,000 requests was sent:
- 3324 requests were processed per second by Redis, which was set up with 6 threads with an average latency of 67 milliseconds.
- 1971 requests were processed per second by KeyDB set up with 10 threads with an average latency of 36 milliseconds.
How can we improve Redis setup performance?
Some general tips for improving Redis setup performance include:
- Use physical hardware, as virtualization may introduce microsecond latency. Appropriate hardware, such as SSDs, High N/W speed, and sufficient memory, can handle the workloads efficiently.
- Keep 20% buffer RAM to perform backend actions like replication, taking the backups, etc, apart from your workload’s capacity.
- Follow the system prerequisites suggested by Redis (KeyDB also suggested the same).
- Use Redis multi-thread mode as read operations, data synchronization, and DB backups are handled by other threads, and the main thread is responsible for establishing and handling client connections.
- Along with the Redis recommendations, check the
ulimitvalues and socket max connectionssomaxconnkernel parameters. - Use pipelining to send multiple commands at once and reduce network latency. This must be suitable to your workloads where request response is not in a synchronous way, mostly suitable for DB loads from backup.
- Optimize data structures and use Redis-specific data structures like hashes or lists where applicable. LPUSH is using more memory and even got OOM on 800GB over the benchmarking, strongly recommend not using this command.
- Configure Redis persistence and eviction policies to match your use case.
- If the environment is heavily write-intensive, try using Redis cluster mode, as data is split into shards on multiple nodes.
- Enable and use Redis in-built LATENCY DOCTOR and MEMORY DOCTOR commands to identify the latency issues and memory issues for the Redis setup.
Conclusion
To summarize, we set up KeyDB and Redis in this benchmarking blog and tried comparing performance and replication speed. Redis in multi-threaded mode is 2X faster than a single thread. So, we have compared it with KeyDB. We observed that KeyDB supports faster performance on only a few Redis commands but not on all commands.
From one of our Memtier performance benchmarking, when we sent 6 million requests, they were processed in 549s by Redis in multi-threaded mode and 1603s by KeyDB without loadbalancer. In the case of replication testing, when we tried uploading ~547 million records, Redis took 14 minutes, KeyDB with a loadbalancer took 18 minutes, and KeyDB without a loadbalancer took 19 minutes. So, based on our performance and replication testing, Redis in multi-threaded is better than KeyDB.
Recent upgrades to Redis, like v7.2 show some performance optimization, which could even give better performance. We hope you found this post informative and engaging. For more posts like this one, do subscribe to our newsletter for a weekly dose of cloud native. We’d love to hear your thoughts on this post. Please feel free reach out and start a conversion with Nagaraju Rapelli who lead the technical piece and Sonali Srivastava who weaved a story around this blog post.
Stay updated with latest in AI and Cloud Native tech
We hate 😖 spam as much as you do! You're in a safe company.
Only delivering solid AI & cloud native content.
Posts You Might Like