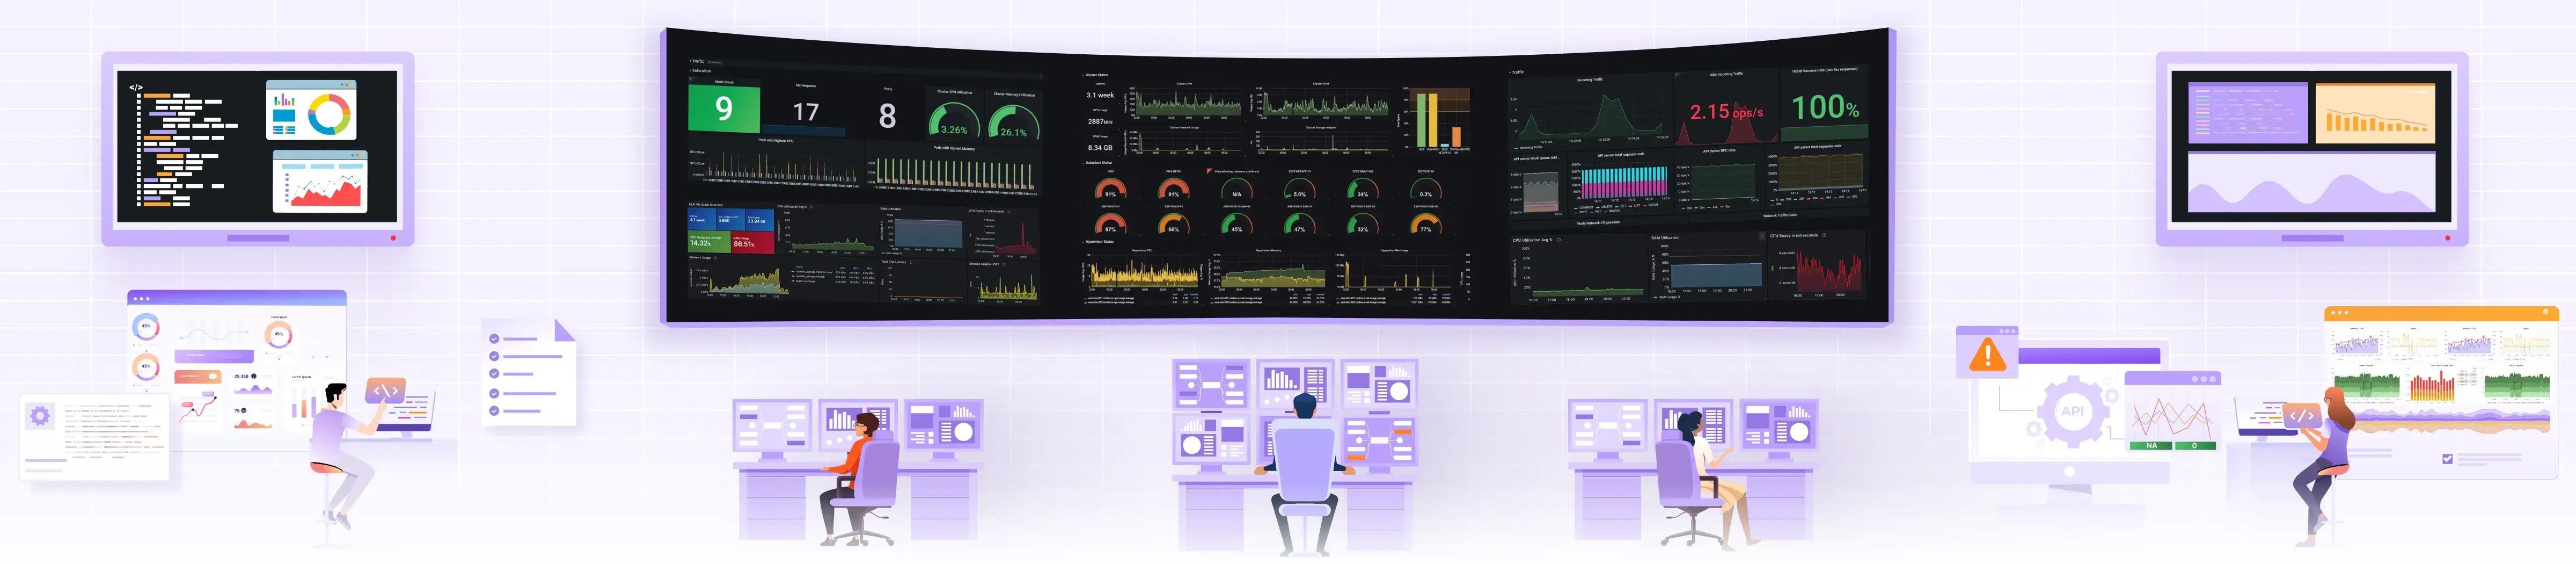
Metrics at a Glance for Production Clusters

Keeping a close eye on your production clusters is not just good practice—it’s essential for survival. Whether you’re managing applications at scale or ensuring robust service delivery, understanding the vital signs of your clusters through metrics is like having a dashboard in a race car, giving you real-time insights and foresight into performance bottlenecks, resource usage and the operational health of your car.
However, too much happens in any cluster. There are so many metrics to track that the huge observability data you may collect could become another obstacle to viewing what is actually happening with your cluster. That’s why you should only collect the important metrics that offer you a complete picture of your cluster’s health without overwhelming you.
In this blog post, we will cut through the complexity and spotlight the essential metrics you need on your radar to quickly detect and address issues as they arise. From CPU usage to network throughput, we’ll break down each metric, show you how to monitor them effectively and provide the queries that get you the data you need. Before we dive into the specifics of which metrics to monitor, let’s understand the foundational monitoring principles that guide our approach. We’ll explore the RED and USE methods along with the Four Golden Signals, providing a robust framework for what to measure and why it matters in maintaining the health of your production clusters.
Monitoring Principles
Effective monitoring is the cornerstone of maintaining the health and performance of your production clusters. It helps you catch issues early, optimize resource usage, and ensure that your systems are running smoothly. In this section, we introduce two essential monitoring frameworks — USE and RED — and the Four Golden Signals. These principles provide a structured approach to monitoring, making it easier to interpret vast amounts of data and identify critical performance metrics. By understanding and applying these principles, you can transform raw data into actionable insights that keep your systems in top shape.
RED and USE method
In modern systems, keeping track of numerous metrics can be overwhelming, especially when troubleshooting or simply checking for issues. To make this easier, you can use two helpful acronyms: USE and RED.
The USE Method (Utilization, Saturation, Errors) was introduced by Brendan Gregg, a renowned performance engineer:
- Utilization: Measures how busy your resources are.
- Saturation: Shows how much backlog or congestion there is.
- Errors: Counts the number of error events.
The RED Method was introduced by Tom Wilkie. Drawing from his experiences at Google, Wilkie developed this methodology to focus on three key metrics for monitoring microservices (Rate, Errors, and Duration):
- Rate: Measures the request throughput.
- Errors: Tracks the error rates.
- Duration: Measures how long requests take to be processed.
The USE method focuses on resource performance from an internal perspective, while the RED method looks at request performance from an external, workload-focused perspective. Together, they give you a comprehensive view of system health by covering both resource usage and workload behavior. By using these standard performance metrics, USE and RED provide a solid foundation for monitoring and diagnosing issues in complex systems.
Four Golden Signals
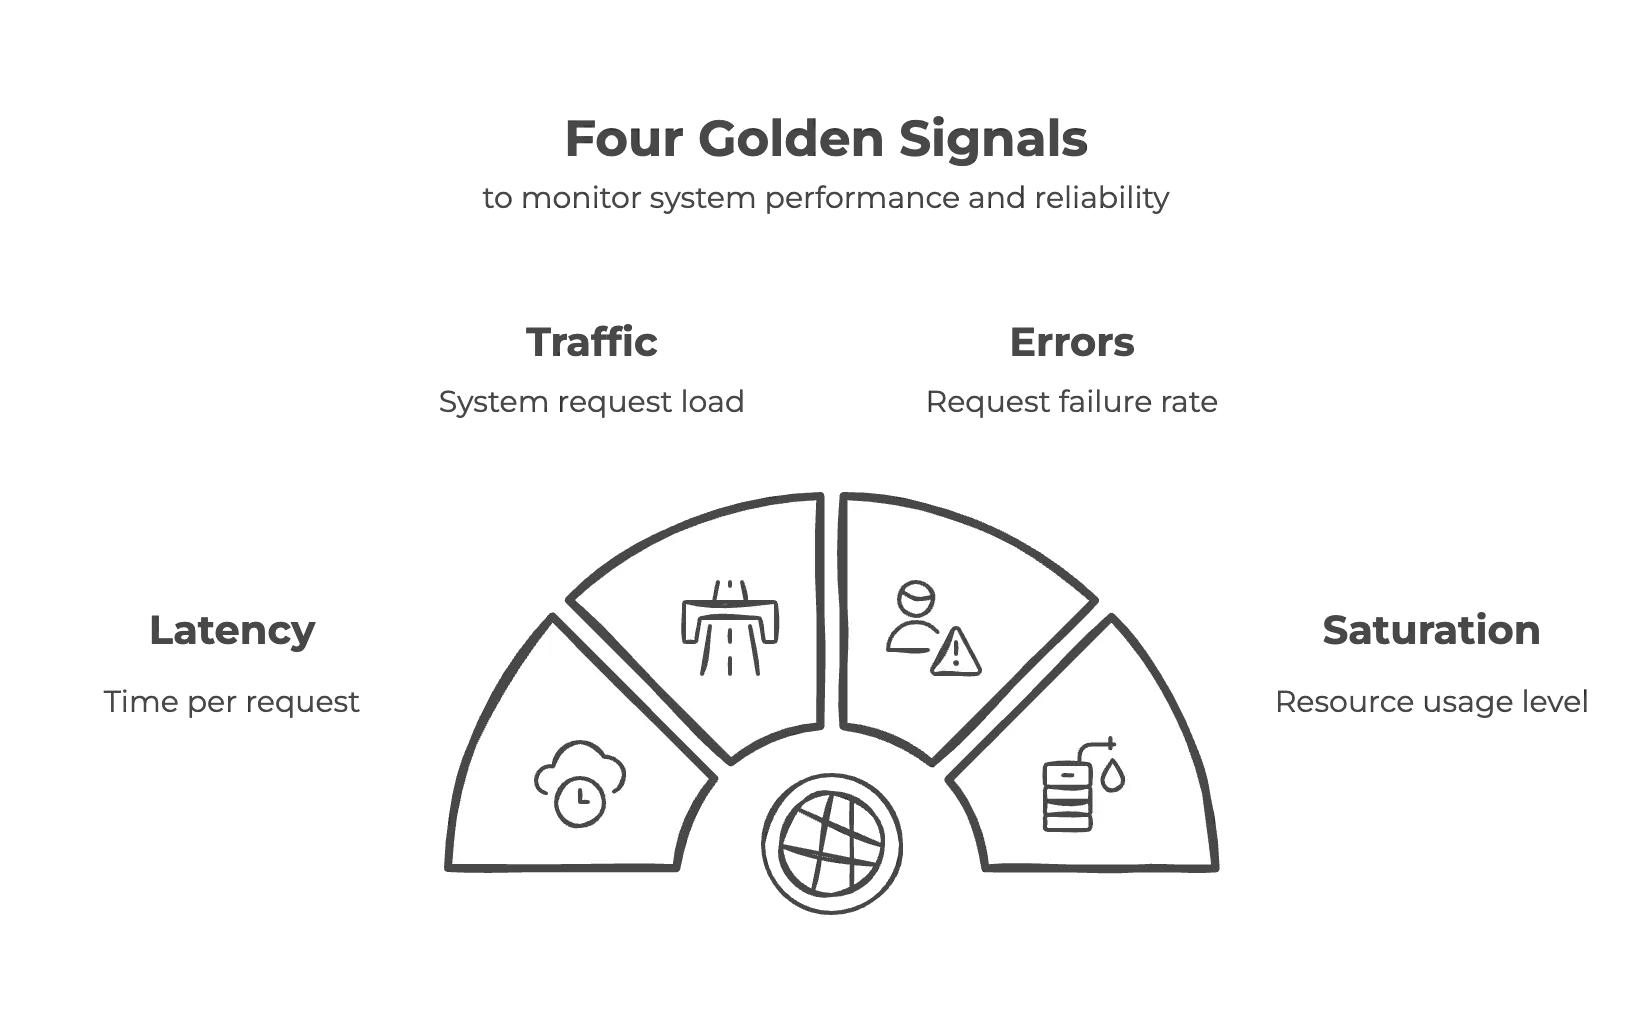
The Four Golden Signals — Latency, Traffic, Errors, and Saturation — are foundational metrics introduced in Google’s Site Reliability Engineering (SRE) practices to monitor system performance and reliability. According to this method. dashboards should address all the fundamental questions about your service. These signals are essential for understanding system performance and should be prioritized when selecting metrics to monitor.
- Latency: Refers to the time taken to handle a request, distinguishing between successful and failed requests.
- Traffic: Measures the demand placed on the system, typically quantified by metrics like HTTP requests per second or network I/O rate.
- Errors: Represents the rate of failed requests, including explicit errors like HTTP 500s and implicit errors like incorrect content responses.
- Saturation: Indicates how “full” the service is, emphasizing the most constrained resources and predicting impending saturation for proactive maintenance.
By monitoring these four golden signals and promptly alerting administrators or support engineers when issues arise, your cluster will benefit from comprehensive monitoring coverage, ensuring reliability and performance.
Using Four Golden Signals with for Comprehensive Monitoring
If you’re managing a production Kubernetes cluster, you know the importance of staying on top of your monitoring game. We’re here to simplify your monitoring approach by integrating the RED and USE methods with Google’s Four Golden Signals, enabling comprehensive monitoring from a single dashboard. This approach allows you to swiftly spot and address issues, ensuring your cluster operates smoothly without the hassle of jumping between multiple dashboards. To get started, you can download the Monitoring Golden Signals for Kubernetes Grafana dashboard.
Let’s jump into each golden signal to understand what metrics should be monitored to track them.
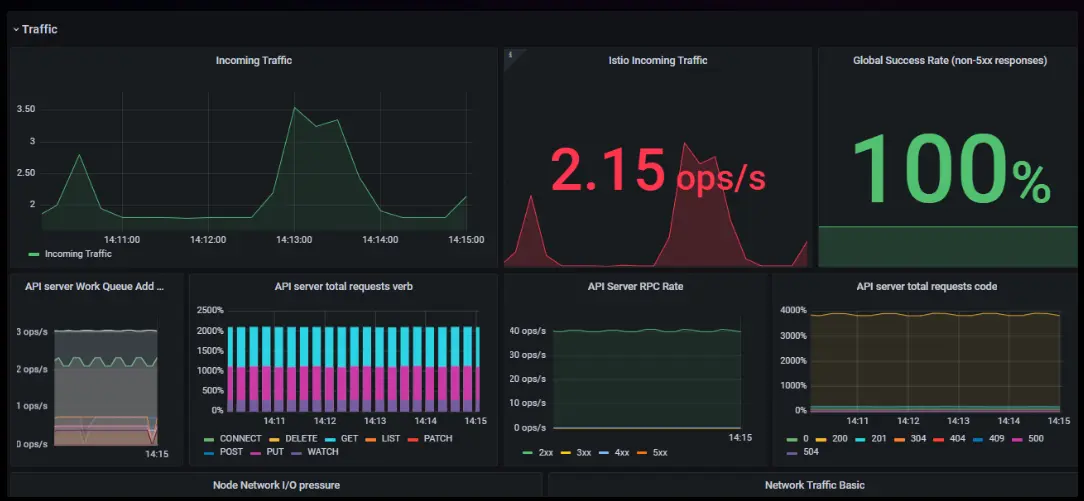
Traffic: What is it and how to monitor it?
If we consider Kubernetes a city’s road system, then pods will be cars, nodes will be streets, and services will be traffic lights that manage the flow. In this case, monitoring in Kubernetes is like using traffic cameras and sensors at crossroads to keep everything moving smoothly and avoid traffic jams.
Network I/O is like the main roads that handle cars coming into and going out of the city. If these roads are too busy, it slows everything down. The API server is like a Regional Transport Office (RTO), regulating and overseeing all operations within the cluster, much like traffic and vehicle management in a region. Monitoring traffic to external services such as databases is also important, similar to watching vehicles travel to other cities. You can use tools like the blackbox exporter to keep an eye on traffic leaving Kubernetes. This highlights the importance of pinpointing key areas for monitoring traffic flow.
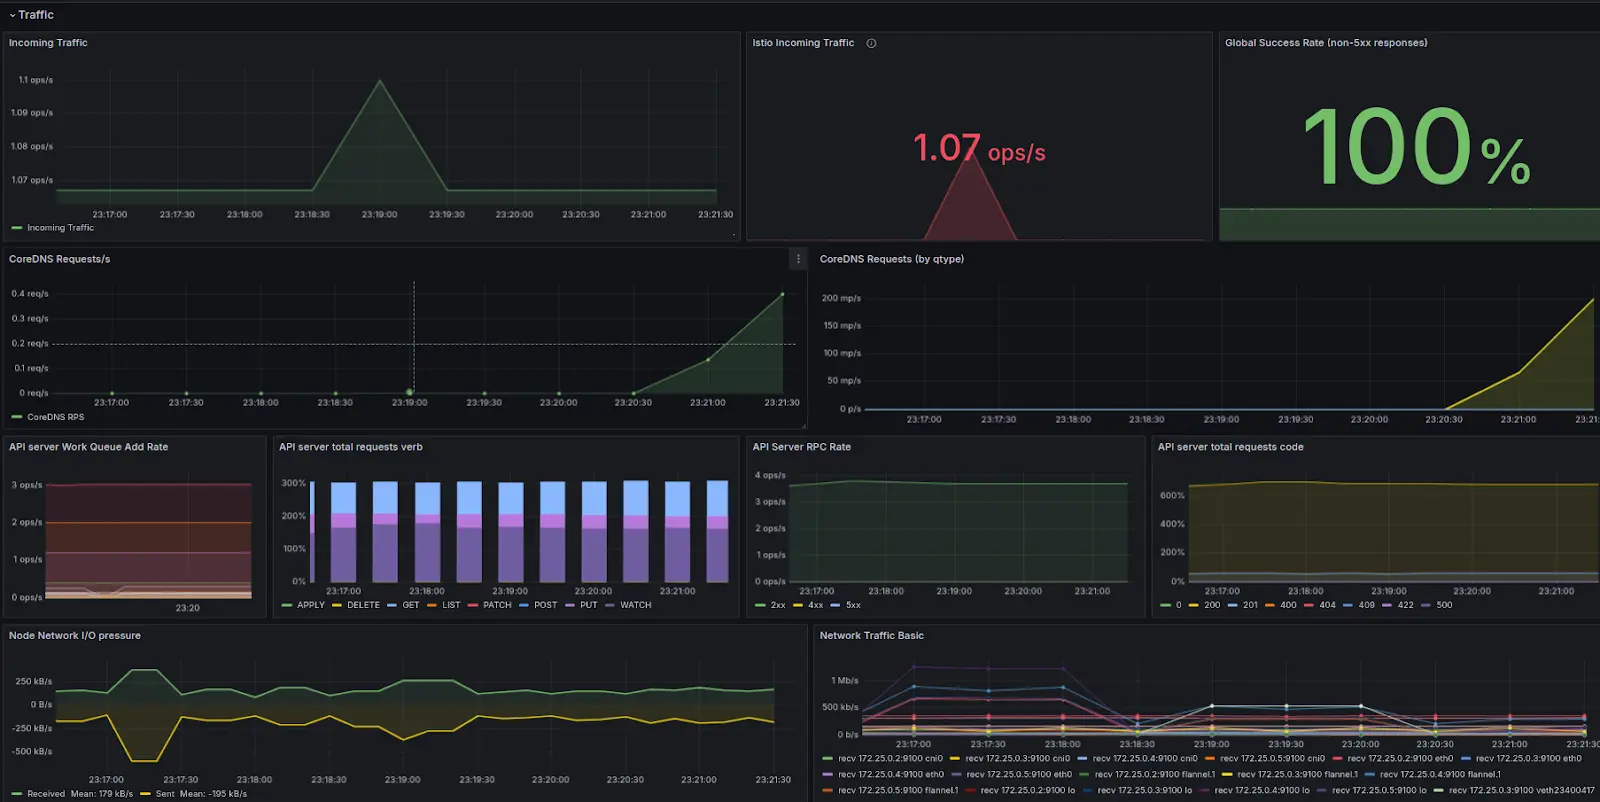
Below, we outline the primary and general metrics for monitoring the traffic.
| Component (Dashboard Title) | Metric | Why Monitor this Metric |
|---|---|---|
| Ingress Traffic (Istio) | istio_requests_total | Tracks the total number of requests handled by Istio, essential for understanding ingress controller load and overall health. |
| API Server Traffic | apiserver_request_total | Measures the number of API server requests, which helps in monitoring control plane load and identifying potential bottlenecks. |
| API Server Traffic | workqueue_adds_total | Indicates the total number of items added to work queues, helping identify workload spikes and manage resource allocation effectively. |
| Node Traffic | node_network_receive_bytes_total node_network_transmit_bytes_total | Monitors data received/transmitted by nodes, which is crucial for identifying and addressing network capacity issues. |
| Node Traffic | node_network_receive_packets_total node_network_transmit_packets_total | Monitors the number of packets received/transmitted, important for analyzing network traffic, identifying issues, and maintaining robust network communication. |
| Workload Traffic | container_network_receive_bytes_total container_network_transmit_bytes_total | Vital for monitoring the amount of network traffic received/transmitted by containers, ensuring proper traffic handling and performance. |
| Storage Operations | storage_operation_duration_seconds_bucket | Provides insights into storage operation performance, helping diagnose and address slow disk access issues. |
| CoreDNS Requests/s | coredns_dns_requests_total | Monitors the number of DNS queries handled by CoreDNS, ensuring reliable service discovery and network performance. |
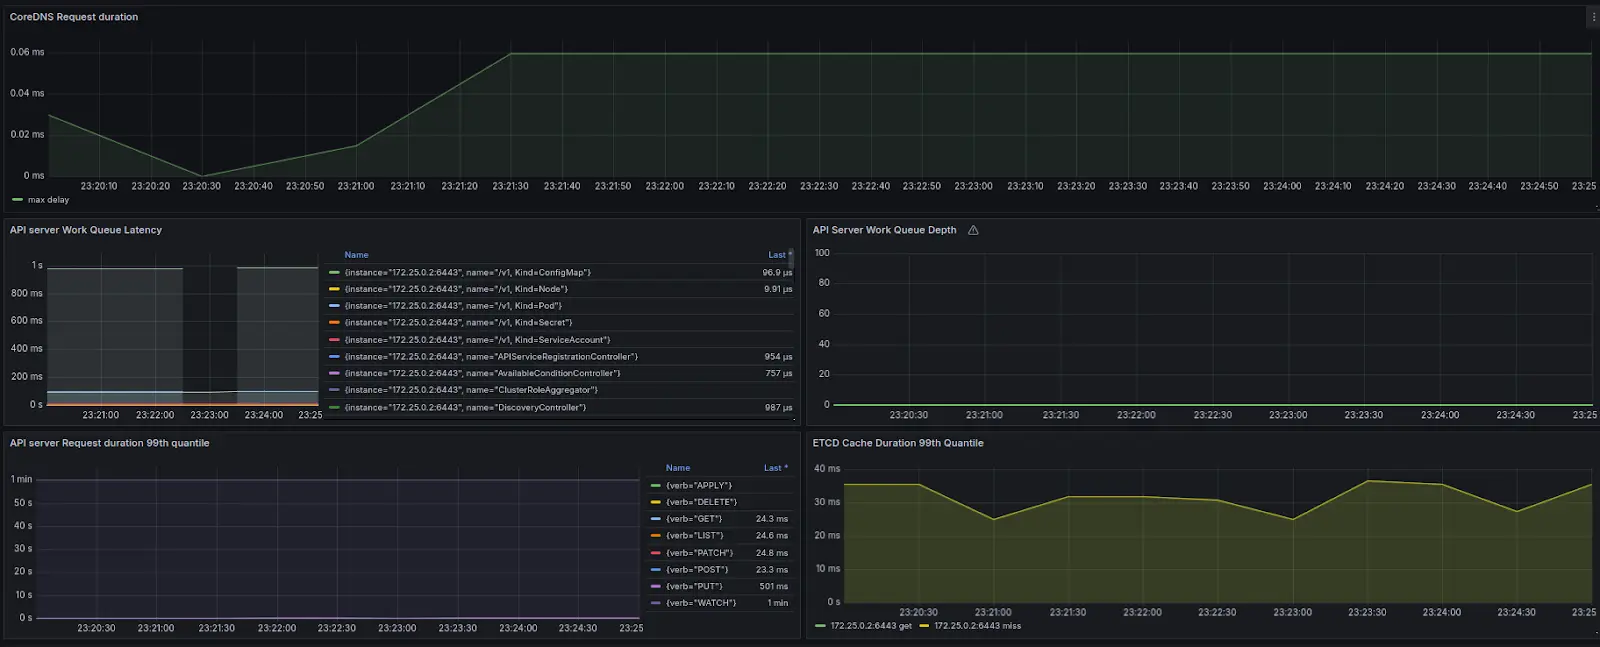
Latency: What is it and how to monitor it?
To understand the latency in Kubernetes, let’s take the previous example of traffic system. Latency in Kubernetes is like delays in a city’s traffic system, where slowdowns at various points affect overall efficiency. If a major road is under construction or blocked due to an accident (slow data processing), cars must take detours, increasing travel time. Similarly, when a microservice is overloaded, requests pile up, causing system-wide slowdowns.
Traffic lights that take too long to change (rate-limited APIs or overloaded queues) create long waiting lines, much like API call delays that hold up processing. Similarly, pod startup delays are like traffic signals malfunctioning cars remain idle, and congestion builds up, just as new pods taking too long to initialize slow down request handling.
During rush hour congestion, roads get overwhelmed, making travel slower for everyone. In Kubernetes, when resources like CPU and memory are exhausted, requests are delayed, affecting performance. Likewise, a single-lane road with no passing option (sequential processing) forces cars to crawl behind slow-moving vehicles, just as inefficient sequential request handling slows down application performance.
Just as city planners use traffic monitoring and smart infrastructure to optimize flow, engineers must track key latency metrics to prevent bottlenecks in Kubernetes.
| Component (Dashboard Title) | Metric | Why Monitor This Metric |
|---|---|---|
| Pod Start Duration | kubelet_pod_start_duration_seconds_bucket | Monitors time taken for pods to start, crucial for optimizing scaling and recovery processes. |
| Pod Startup Latency | kubelet_pod_worker_duration_seconds_bucket | Tracks duration of pod operations, important for assessing pod management efficiency. |
| ETCD Cache Duration 99th Quantile | etcd_request_duration_seconds_bucket | Essential for monitoring ETCD request processing latency, impacts overall cluster performance. |
| API Server Request Duration 99th Quantile | apiserver_request_duration_seconds_bucket | Important for understanding API server response times, indicates control plane health. |
| API Server Work Queue Latency | workqueue_queue_duration_seconds_bucket | Measures delays in API server work queues, vital for spotting potential processing issues. |
| API Server Work Queue Depth | workqueue_depth | Provides insight into API server queue load, critical for preventing system overloads. |
| CoreDNS Request Duration | coredns_dns_request_duration_seconds_bucket | Tracks CoreDNS DNS request processing times, key for efficient network resolution. |
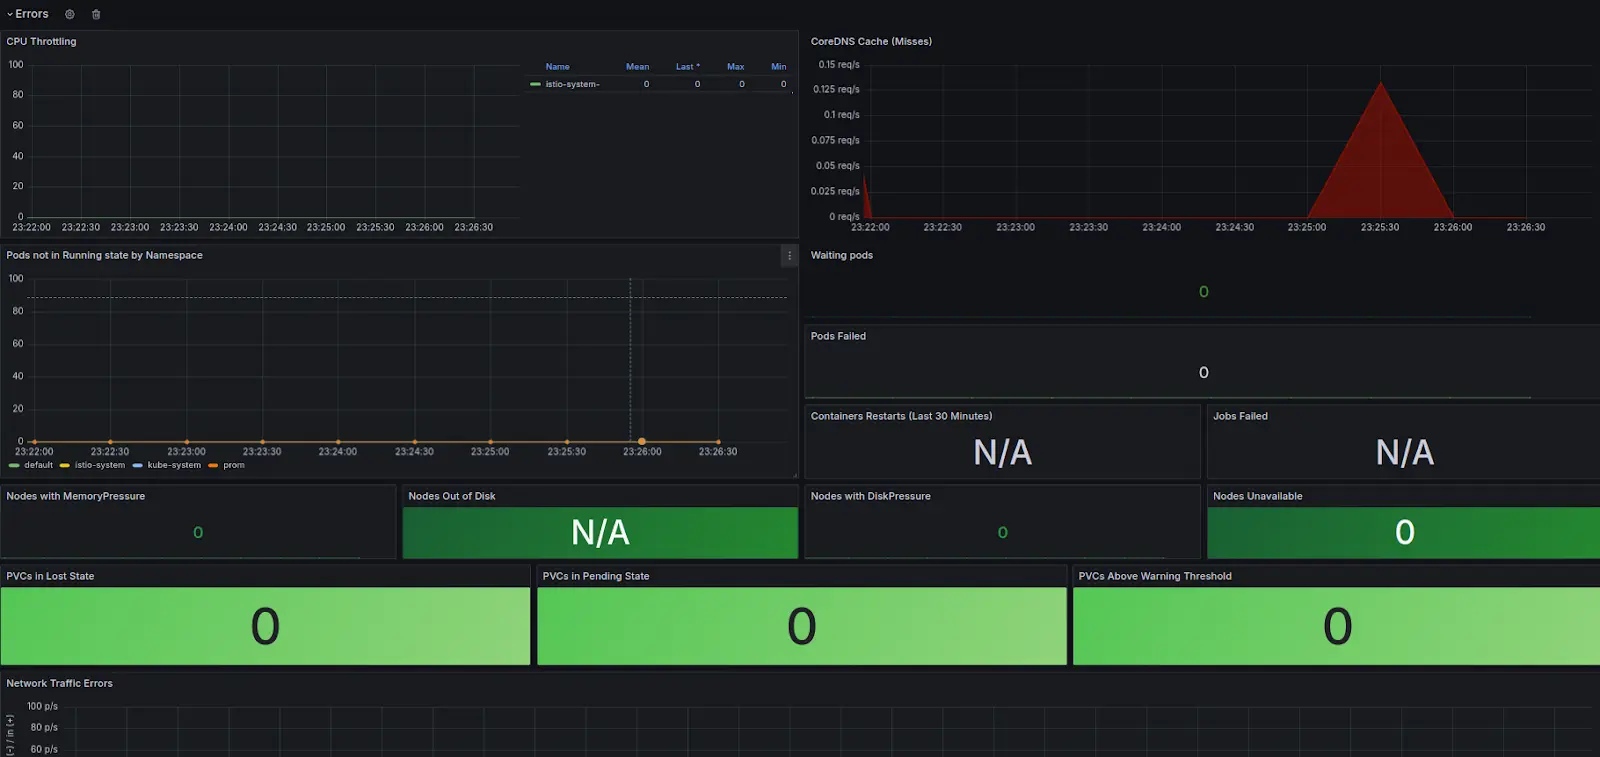
Errors: What is it and how to monitor it?
Again, continuing our analogy, let’s consider a Kubernetes cluster like a city’s road system. Everything needs to move smoothly for the city to function well. But what happens when things go wrong?
- CoreDNS crashes: It’s like traffic signals failing. Without proper directions, cars (data) can’t find their way, leading to confusion and delays.
- API Server goes down: This is like losing the central traffic control center. The entire system becomes unresponsive, and nothing moves.
- Pod failures: These are like car breakdowns. A few stalled cars won’t stop the whole city, but they slow down traffic in specific lanes (services).
- Node issues (like DiskPressure): Imagine a major road being closed. Cars (pods) have to reroute, leading to congestion and bottlenecks.
Just as traffic disruptions cause delays and frustration, Kubernetes failures impact SLAs, SLOs, and user experience. That’s why monitoring errors is like a real-time traffic control system. It detects problems early and helps keep everything running smoothly. The following metrics will help monitor the errors.
| Component (Dashboard Title) | Metric | Why Monitor this Metric |
|---|---|---|
| CoreDNS | coredns_cache_misses_total | Tracks cache misses in CoreDNS, important for identifying DNS resolution issues affecting cluster connectivity and performance. |
| API Server Errors | apiserver_request_total | Monitors API server request errors, crucial for detecting and diagnosing failures in handling cluster management tasks. |
| Nodes | kube_node_spec_unschedulable | Counts nodes that are unschedulable, essential for understanding cluster capacity and scheduling issues. |
| Nodes | kube_node_status_condition | Tracks node conditions like ‘OutOfDisk’, ‘DiskPressure’, ‘MemoryPressure’, important for preemptive system health alerts. |
| Kubelet | kubelet_runtime_operations_errors_total | Measures error rates in kubelet operations, key for maintaining node and pod health. |
| Workloads | kube_pod_status_phase | Monitors pods in failed states, critical for identifying failed workloads and ensuring reliability. |
| Network | node_network_receive_errs_total, node_network_transmit_errs_total | Monitors network errors in data transmission and reception, vital for maintaining robust network communication. |
Saturation: What is it and how to monitor it?
To explain saturation, we will take you to the example of the city traffic system again. CPU and memory utilization are akin to monitoring the flow of vehicles — too much traffic causes congestion, slowing down the city. Node resource exhaustion is similar to key intersections getting overwhelmed, which can halt traffic across the city. Network capacity matches the width and condition of roads; inadequate capacity leads to bottlenecks. Monitoring the top ten nodes and pods with the highest resource utilization is like tracking the busiest areas in the city to prevent and manage traffic jams more effectively. This approach ensures smooth operation and prevents system slowdowns.
The following metrics help to quickly identify the possible slowdowns in Kubernetes clusters.
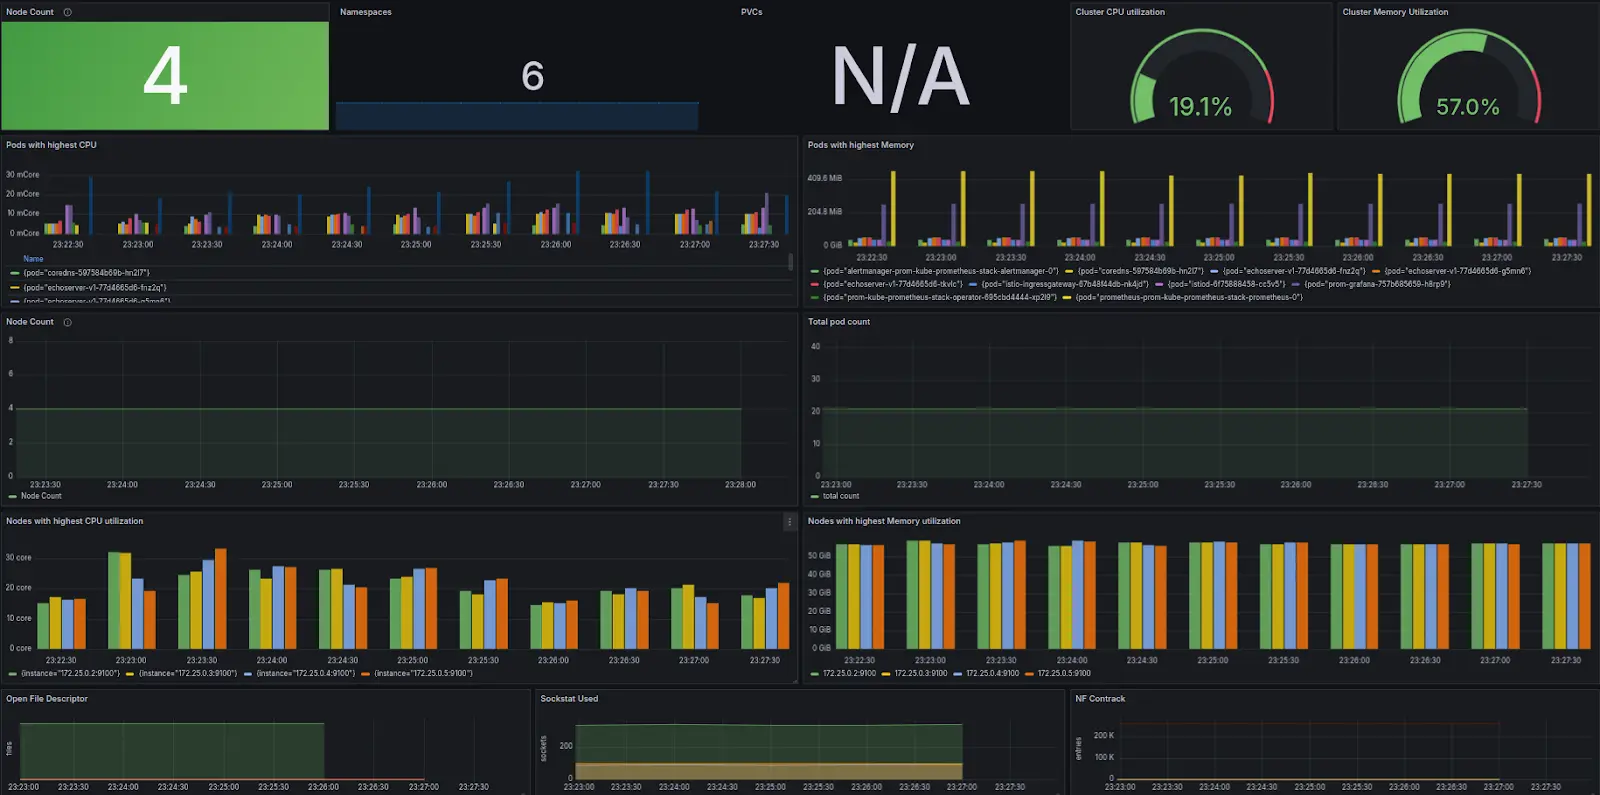
| Component (Dashboard Title) | Metric | Importance of Monitoring that Metric |
|---|---|---|
| Cluster Memory Utilization | node_memory_MemFree_bytes, node_memory_MemTotal_bytes, node_memory_Buffers_bytes, node_memory_Cached_bytes | Tracks memory usage metrics to prevent saturation and ensure resource availability. |
| Cluster CPU Utilization | node_cpu_seconds_total | Monitors CPU usage to prevent overload and maintain performance efficiency. |
| Node Count | kube_node_labels | Counts the number of nodes, essential for scaling and resource allocation. |
| PVCs | kube_persistentvolumeclaim_info | Tracks persistent volume claims, important for storage resource management. |
| Node Parameters | node_filefd_maximum node_filefd_allocated | Tracks maximum file descriptors, prevents resource exhaustion. Tracks allocated file descriptors, prevents resource exhaustion. |
| Node Parameters | node_sockstat_sockets_used | Monitors sockets in use, crucial for system stability. |
| Node Parameters | node_nf_conntrack_entries node_nf_conntrack_entries_limit | Tracks active network connections, ensures capacity isn’t exceeded. Monitors conntrack entries limit, prevents network tracking overload. |
Note: This dashboard is designed specifically for infrastructure monitoring. To cover application insights, you need to create similar dashboards from application metrics, assuming the relevant metrics are available. Additionally, you can generate metrics from logs as needed and incorporate them into these dashboards to achieve a unified view.
Conclusion
By meticulously applying these Four Golden Signals in our monitoring strategy, we ensure a proactive approach to infrastructure management. This not only helps in quick problem resolution but also aids in efficient resource utilization, ultimately enhancing the performance and stability of your Kubernetes cluster. With this comprehensive view provided by this single-dashboard approach, Kubernetes administrators and SREs can effortlessly manage cluster health, allowing them to focus on strategic improvements and innovation. No more navigating through complex monitoring setups—everything you need is now in one place, streamlined for efficiency and effectiveness.
I hope you found this post informative and engaging. I’d love to hear your thoughts on this post; let’s connect and start a conversation on LinkedIn.
Looking for help with observability stack implementation and consulting? Do check out how we’re helping scaling startups & fortune 500 enterprises as an observability consulting services provider.
Stay updated with latest in AI and Cloud Native tech
We hate 😖 spam as much as you do! You're in a safe company.
Only delivering solid AI & cloud native content.
Posts You Might Like