
Root Cause Chronicles: Quivering Queue

River was buried with work. It was time for the Quarterly Earnings call, and they seemed to be getting nowhere. Additional piles of work were being dumped on their desk every day. Business teams did not follow scrum or sprints like the tech folks on the second floor. You had to do whatever was assigned to you, and yesterday.
They had to clear all the pending orders for Q3 that somehow got stuck in the system due to glitches or downtimes and prepare their quarterly summary of dispatch throughput once that was done. River also had to write their self-assessment and performance reviews for all three interns in the team.
River had already been reminded thrice that day by their senior to clear the orders backlog. But River kept getting drawn into meetings and paperwork every time they attempted to sit down with it.
Carter from the second floor had given River some sort of script to finish up the pending orders that were not yet dispatched to paying customers, but had asked River to monitor its progress. “It’s an ad hoc script I’m cobbling together to get this done fast. This may cause issues down the line. Keep checking on it and ping me if something goes wrong”, they had said. Fingers crossed, River pressed the Run button on the pipeline for this script and waited.
“Hey River, care to come in for a minute?” their senior beckoned, pointing at the nearest meeting room, “We need to get on top of your performance review.”
“Hey, Sure…”, River hesitated, “But I think I should monitor this script I just ran. You have been asking me to clear up that backlog of orders for a while, Carter gave me this script to get it resolved.”
“It’s automated, right?” the senior asked.
“Yeah, sure. But Carter asked me to inform them if anything goes wrong!”
“It’ll be alright, Carter knows his job. You don’t need to wait on it. Just come in, and we can finish this conversation. My superiors are breathing down my neck too.”
30 minutes later…
“Hey, Robin!” someone tapped on their shoulder.
Robin was neck-deep trying to finish writing a new Terraform module and replied without looking up, “What’s gone wrong?”.
“Payments are failing, customers are unable to buy anything, it just gets stuck on the web page.”
Robin switched to the Grafana dashboard tab, and sure enough, the 5xx volume on web service was rising. It had not hit the critical alert thresholds yet, but customers had already started noticing.
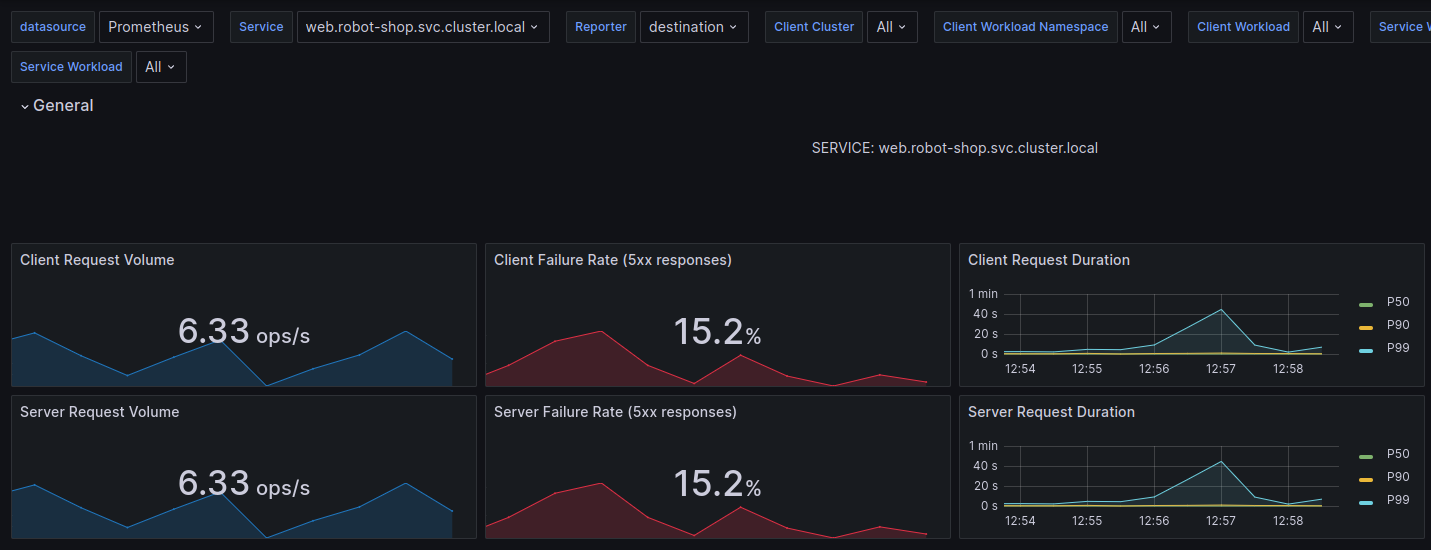
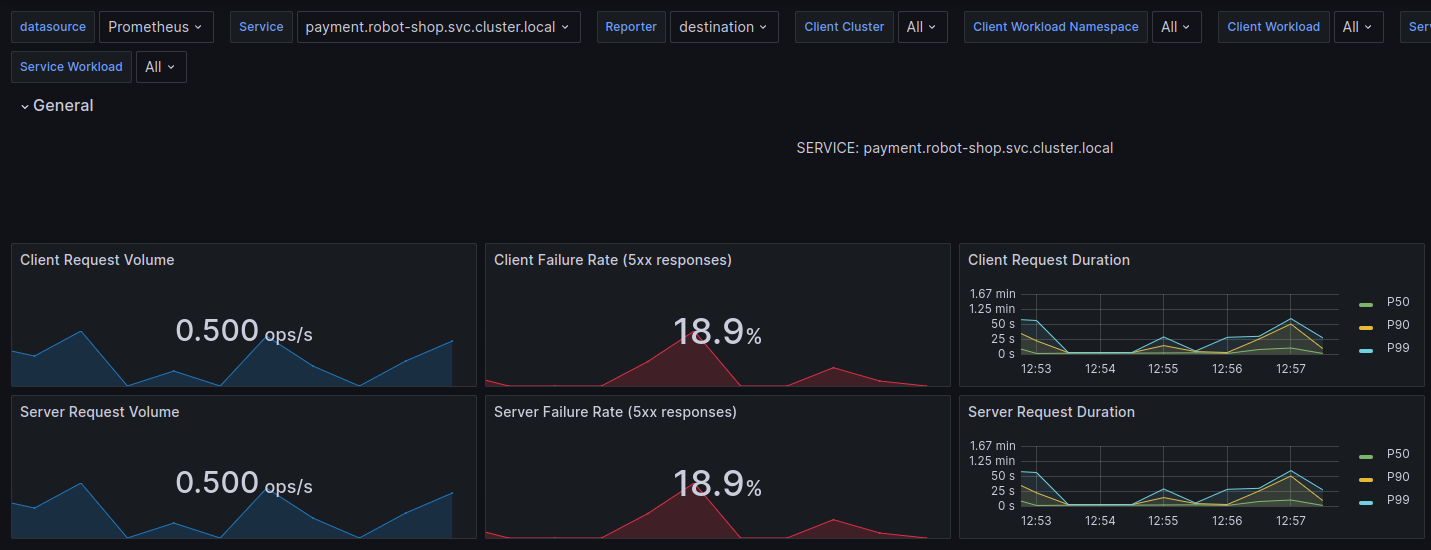
Another day at Robot-Shop
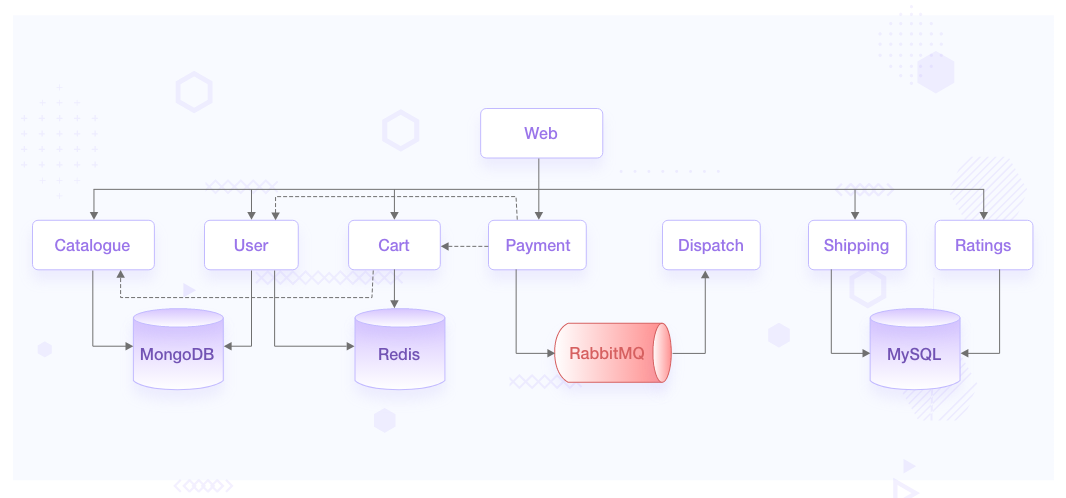
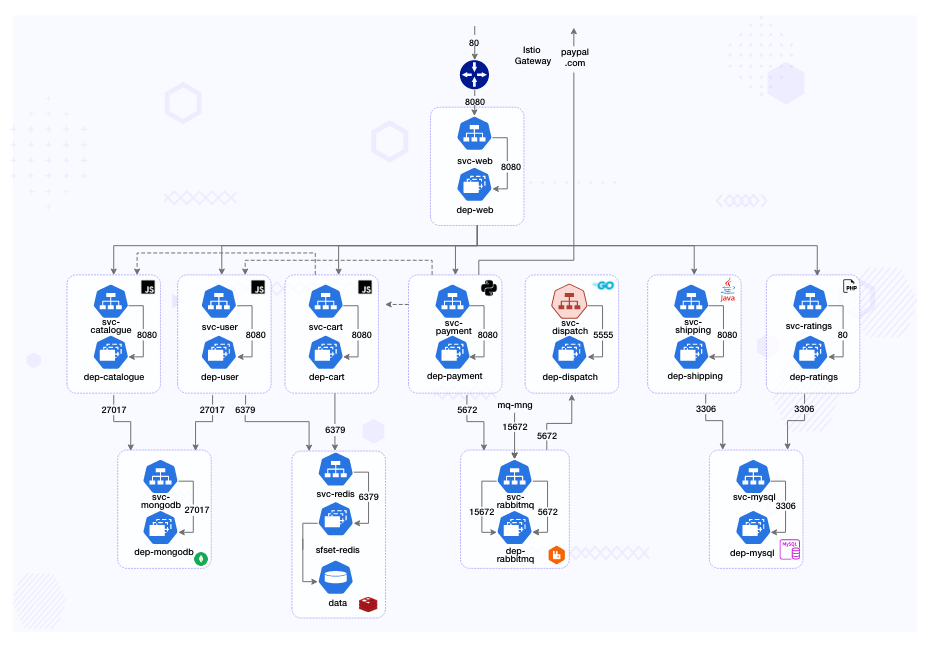
River, Carter, and Robin all work for Robot-Shop Inc. They run a sufficiently complex cloud native architecture to address the needs of their million-plus customers.
- The traffic from load-balancer is routed via a gateway service optimized for traffic ingestion, called Web, which distributes the traffic across various other services.
- User handles user registrations and sessions.
- Catalogue maintains the inventory in a MongoDB datastore.
- Customers can see the ratings of available products via the Ratings service APIs.
- They choose products they like and add them to the Cart, a service backed by Redis cache to temporarily hold the customer’s choices.
- Once the customer pays via the Payment service, the purchased items are published as orders to a RabbitMQ channel.
- These orders are consumed by the Dispatch service and prepared for shipping. Shipping uses MySQL as its datastore, as does Ratings.
Only now, payment failures were rising at an alarming rate. “OK, let’s look at payment logs.” Robin clicked on the attached Grafana dashboard for Payments logs from Loki.

“Payments can’t connect to RabbitMQ! Is the cluster down?” This could be bad. Robin was distraught. If the RabbitMQ cluster was entirely down, it would be hard to recover any messages that were in transit and in-memory. The only way of recovery would be to replay failure logs from the Payments service later. But RabbitMQ was not down, Robin would have received immediate alerts if it were so. “Let’s check the queue health.”
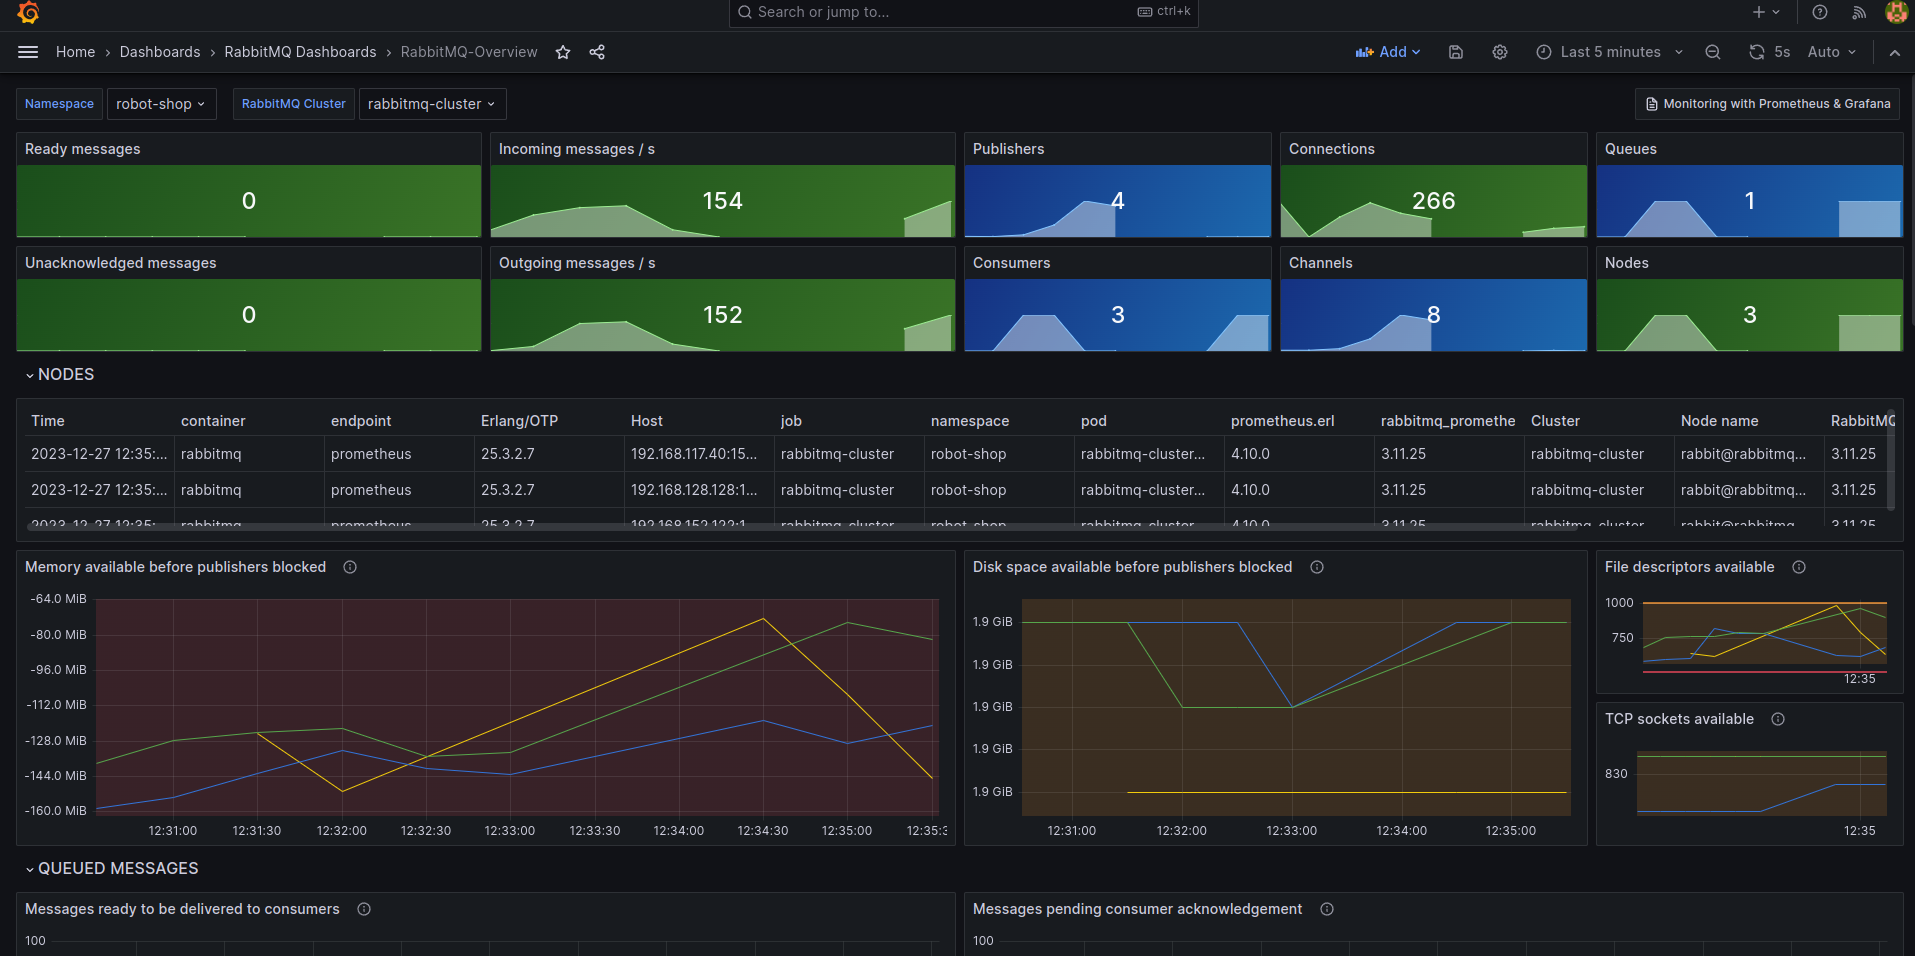
“Oh, wow! Seems the number of messages has gone up drastically in the last 30 minutes. Are we really processing a record number of payments at the end of a quarter?” Robin thought. “Close to 300-350 orders/second. Let me correlate that with the Payments service request count.” Robin jumped around the dashboards with a few keystrokes.
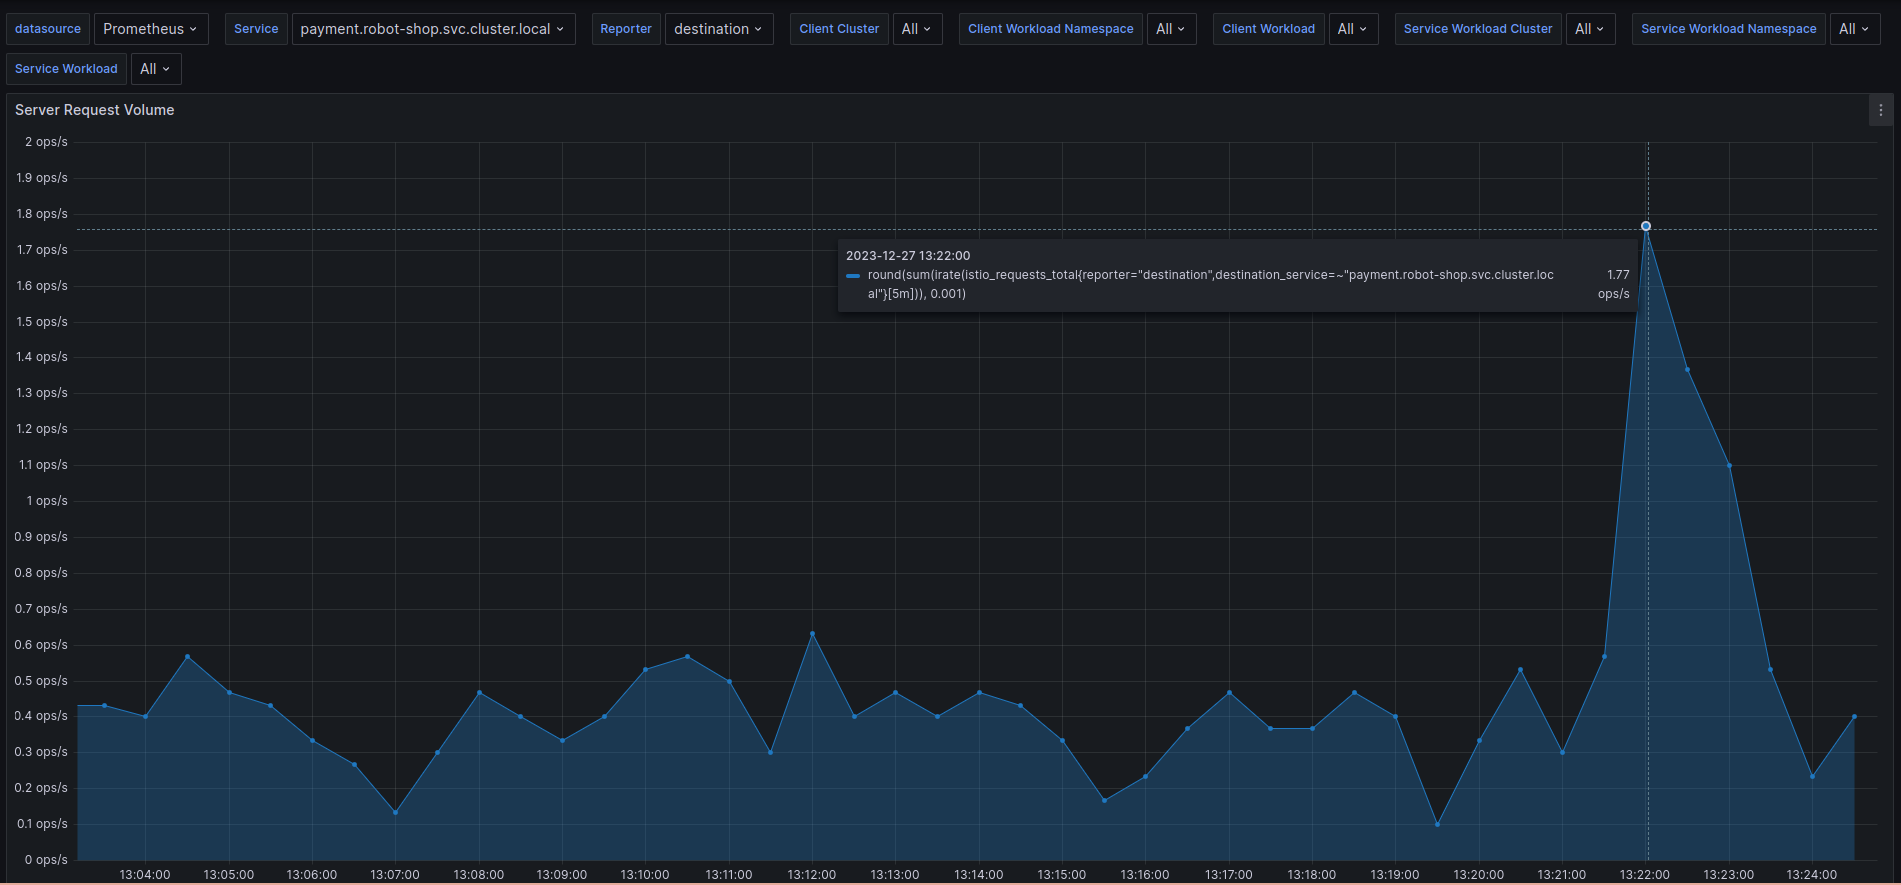
“This does not compute. It can’t be payments! The service is only processing 1-2 payments/second!”, Robin exclaimed.
“Check the publisher count of the queue against the number of payment pods in the deployment!” Blake was there, as were a few other folks around her seat. Robin never felt too comfortable when people looked on as they typed. It was nerve-wracking.
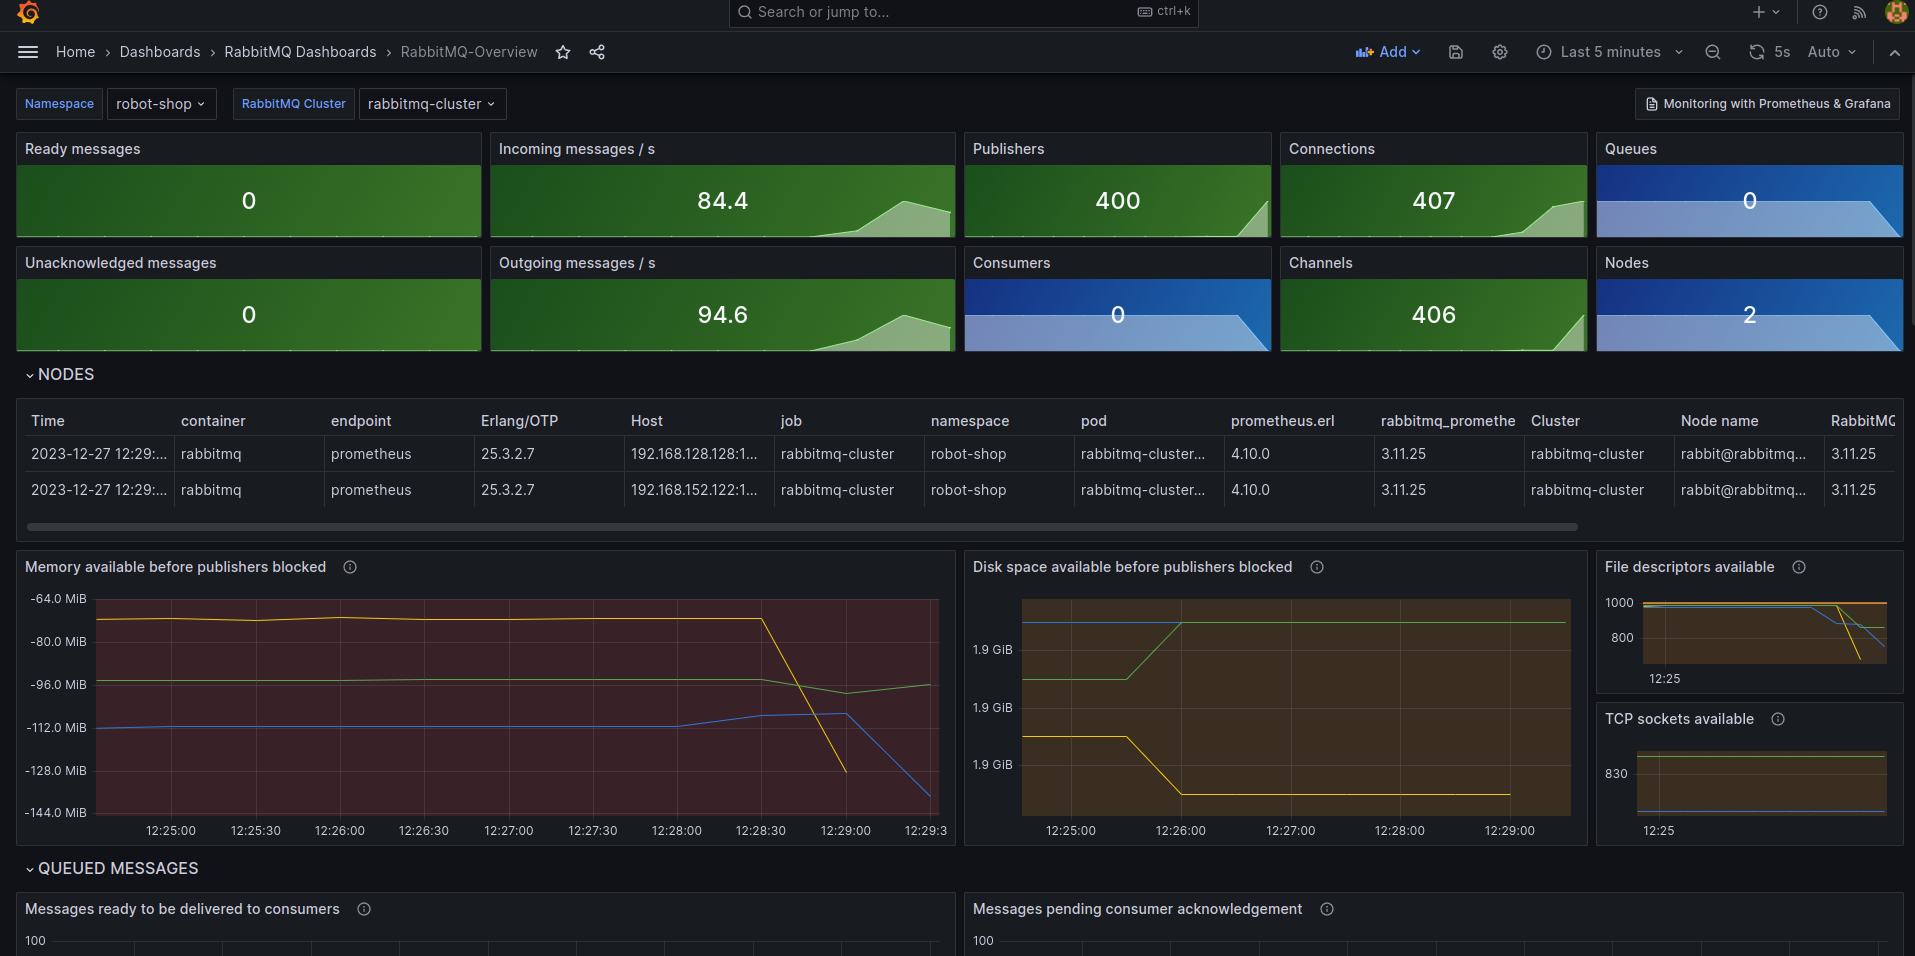
“Whoa, why do we have ~465 publishers?” Blake was right as usual. “Even with auto-scaling enabled, payment doesn’t usually scale beyond 20-30 pods, and right now, we only have 3 of them, the minimum count.”
This was expected, customers never shopped much at the end of the quarter with tax filing around the corner. Overall system load was expected to be at an all-time low as per seasonal traffic analysis data.
“Who, or what, is publishing orders to the queue? Also, how is our consumer service, Dispatch doing?” Blake was curious now; this could escalate very fast if they could not find a solution soon. Blake pulled up a chair and sat down, looking at the graphs Robin had pulled up.
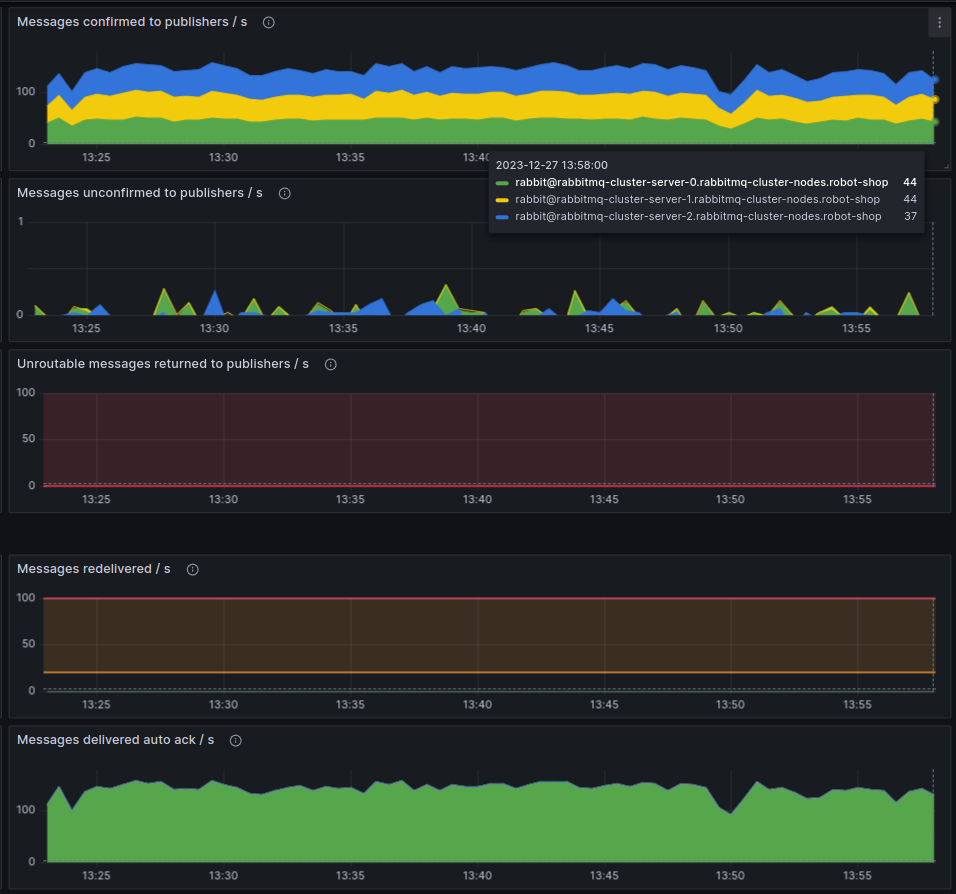
“Consumers look alright! But I wish we had instrumented our apps with OpenTelemetry.” Blake sighed at the onlooking Backend folks. “Right now, we know we have too many publishers, but we don’t know who they are! We need to complete our Tracing sprint, and soon.”
“We have Kiali. It should show which services other than Payments and Dispatch are connected to RabbitMQ,” Robin said.
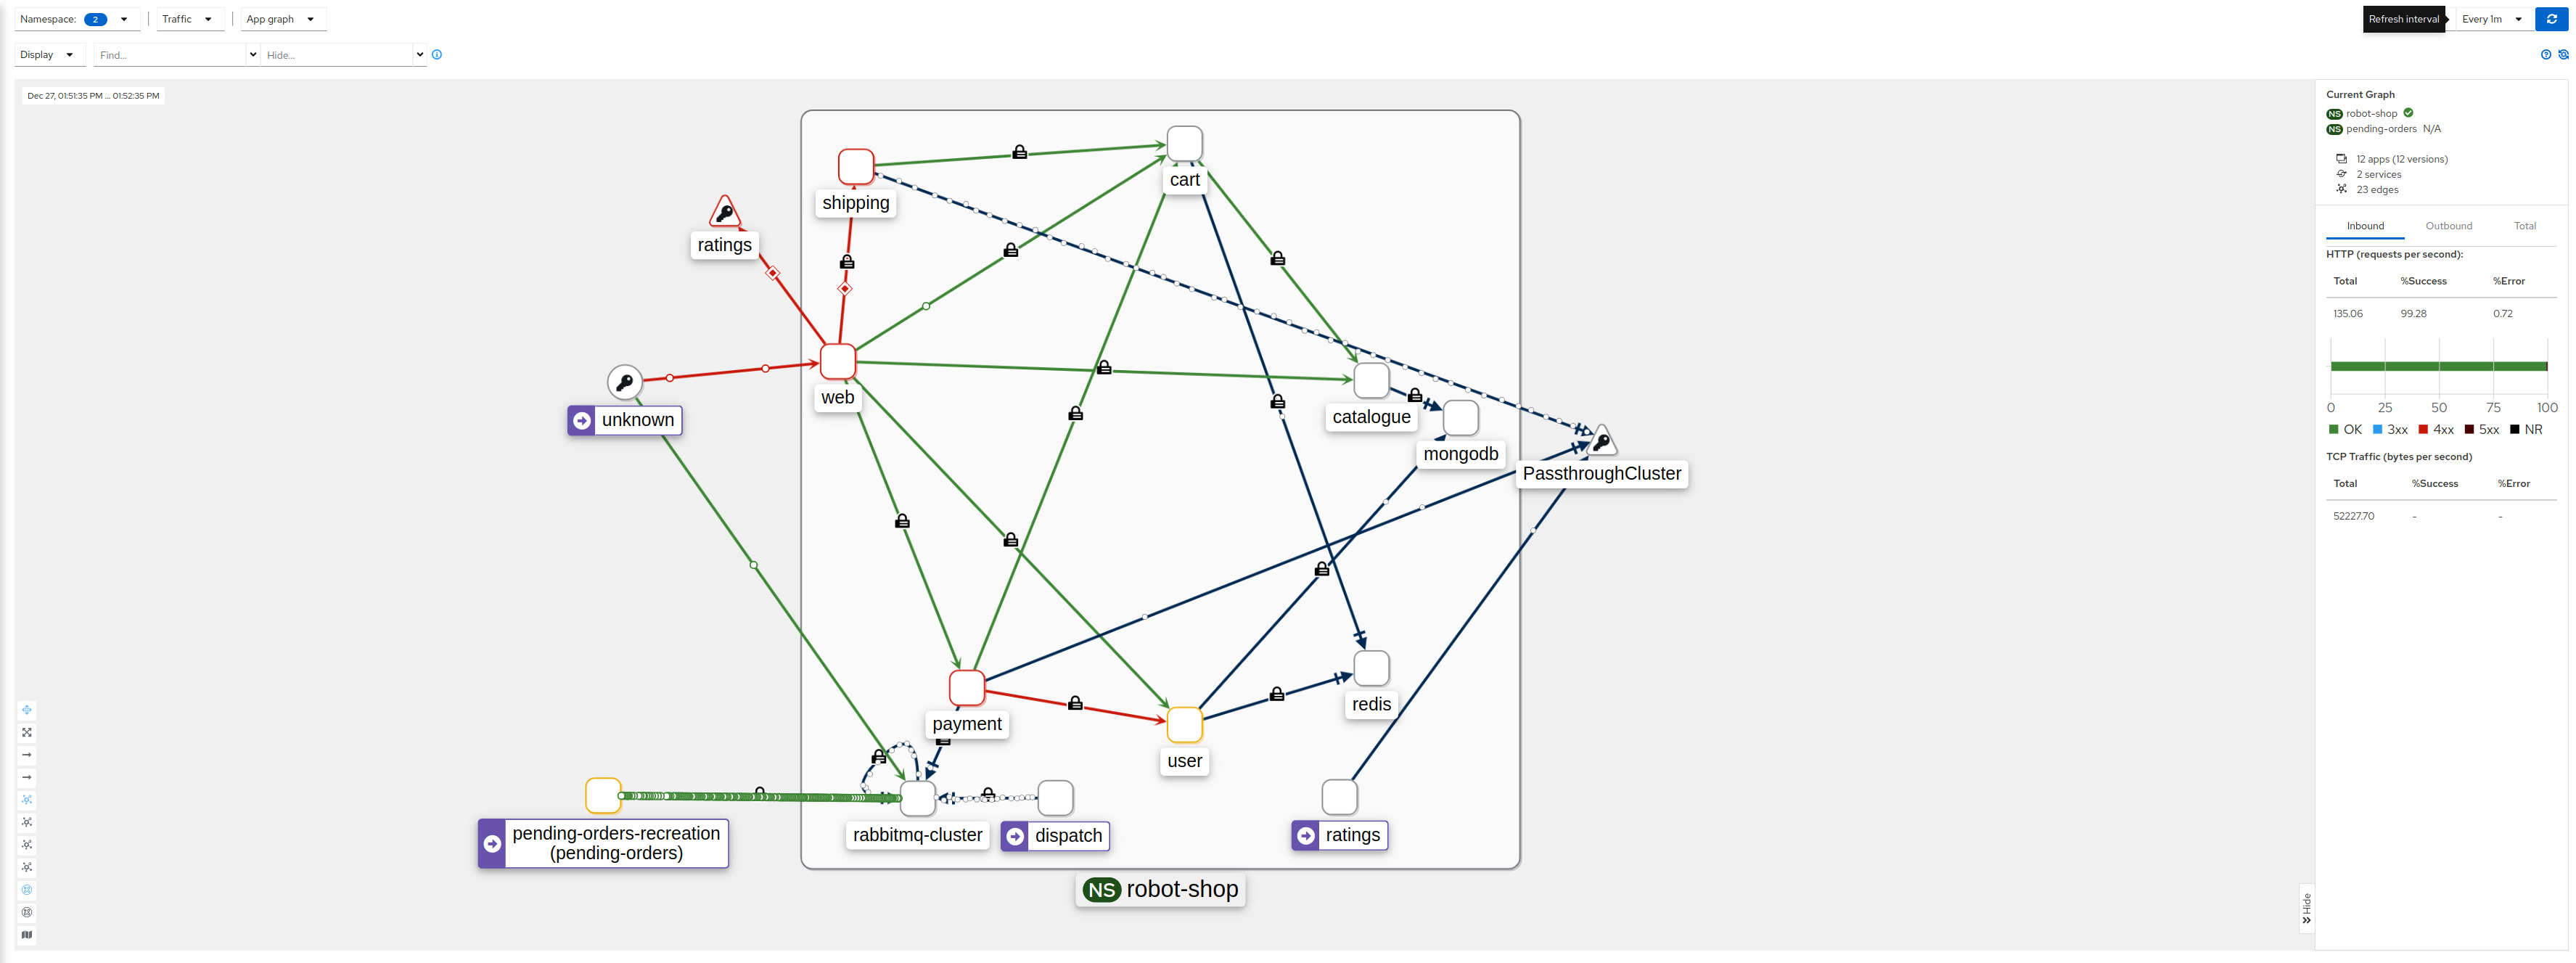
Robin fiddled around with namespace filters until they zoomed in on something.
“It seems some workload called pending-orders-recreation is connecting to RabbitMQ from a namespace called pending-orders.”
“Let’s see what’s running there. I do not know this namespace.”
And lo, around 400 pods with the prefix pending-orders-recreation-xxx were running there.
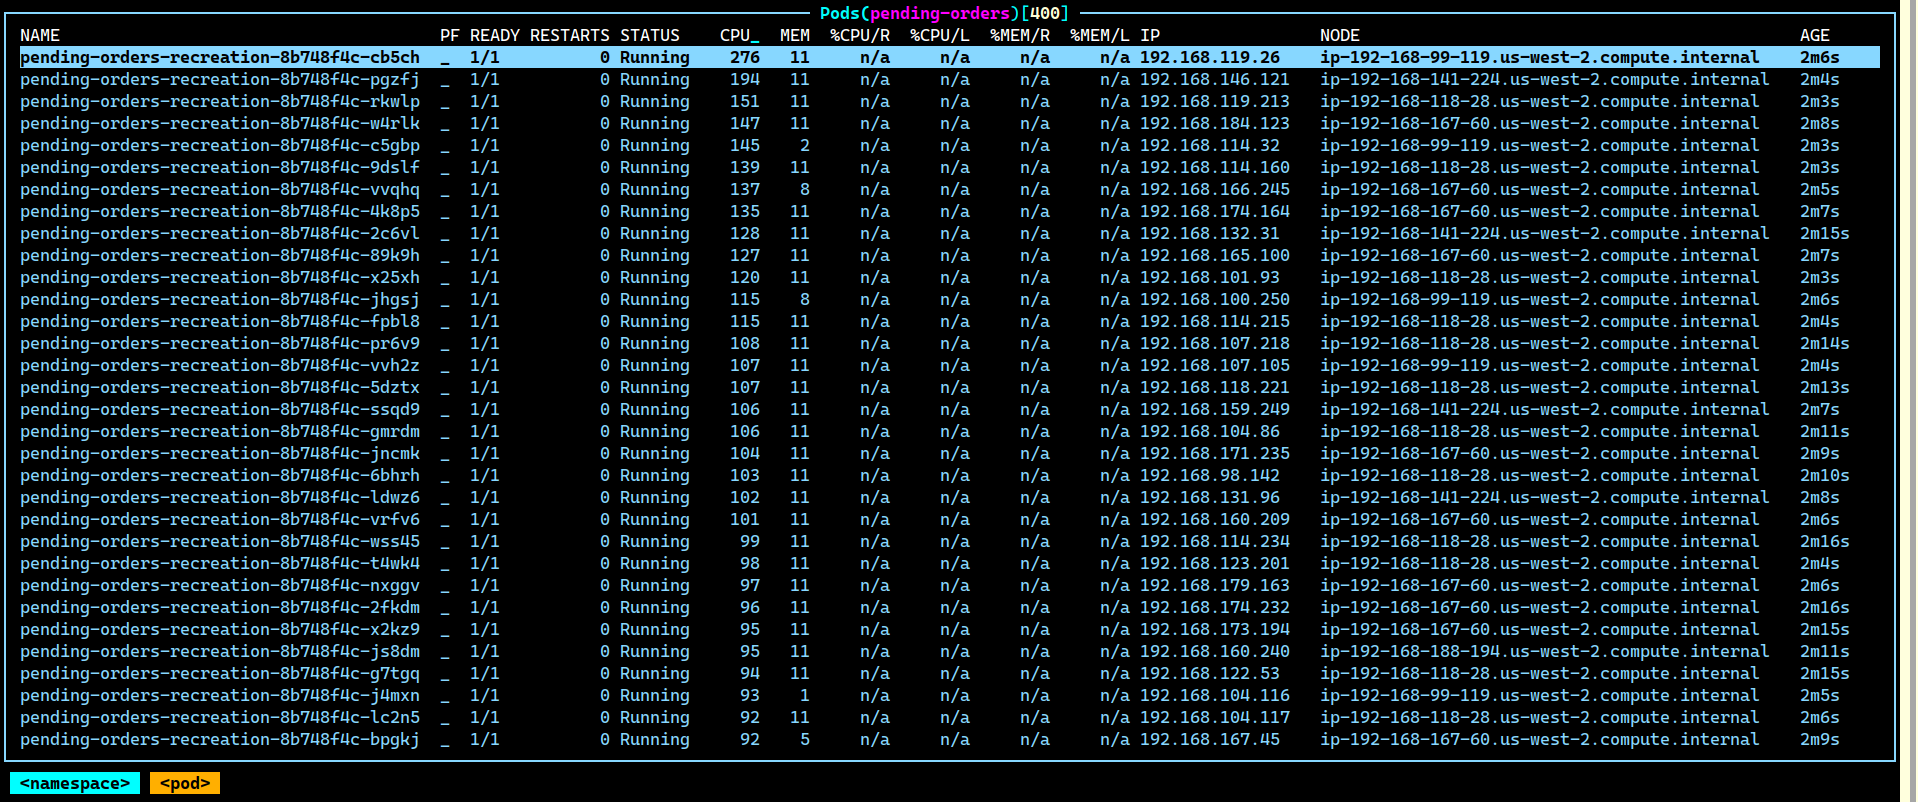
“Who could be running this?” Robin pinged the #engineering channel on Slack:
Hey Team, has anyone deployed a new workload to a namespace called pending-orders in production?
The root cause of all things
Soon, Blake and Robin heard someone rushing up to them. It was Carter: “Hey, that was me. That workload you pinged about just now. What’s up with it?”
“It seems to have taken down our live payments system, what are you running there?” Blake asked.
“Well, it’s the end of the quarter, and the Biz team wanted to automate reconciliation of all pending orders for the last three months that were never dispatched due to glitches or errors. Remember the downtime we had last month on the User service, and a bunch of payments went bad? We are recreating those from scratch now.”
“All of them? How many are we talking about?”
“Ah, close to half a million?” Carter was sweating, “They need to complete by today, it’s the end of the quarter. Otherwise, our numbers will look all wrong. How do we fix this now?”
“Can we stop the workload and let the queue recover?” Blake queried. “Because right now the cluster is dying under the load. Most messages are getting re-queued.”
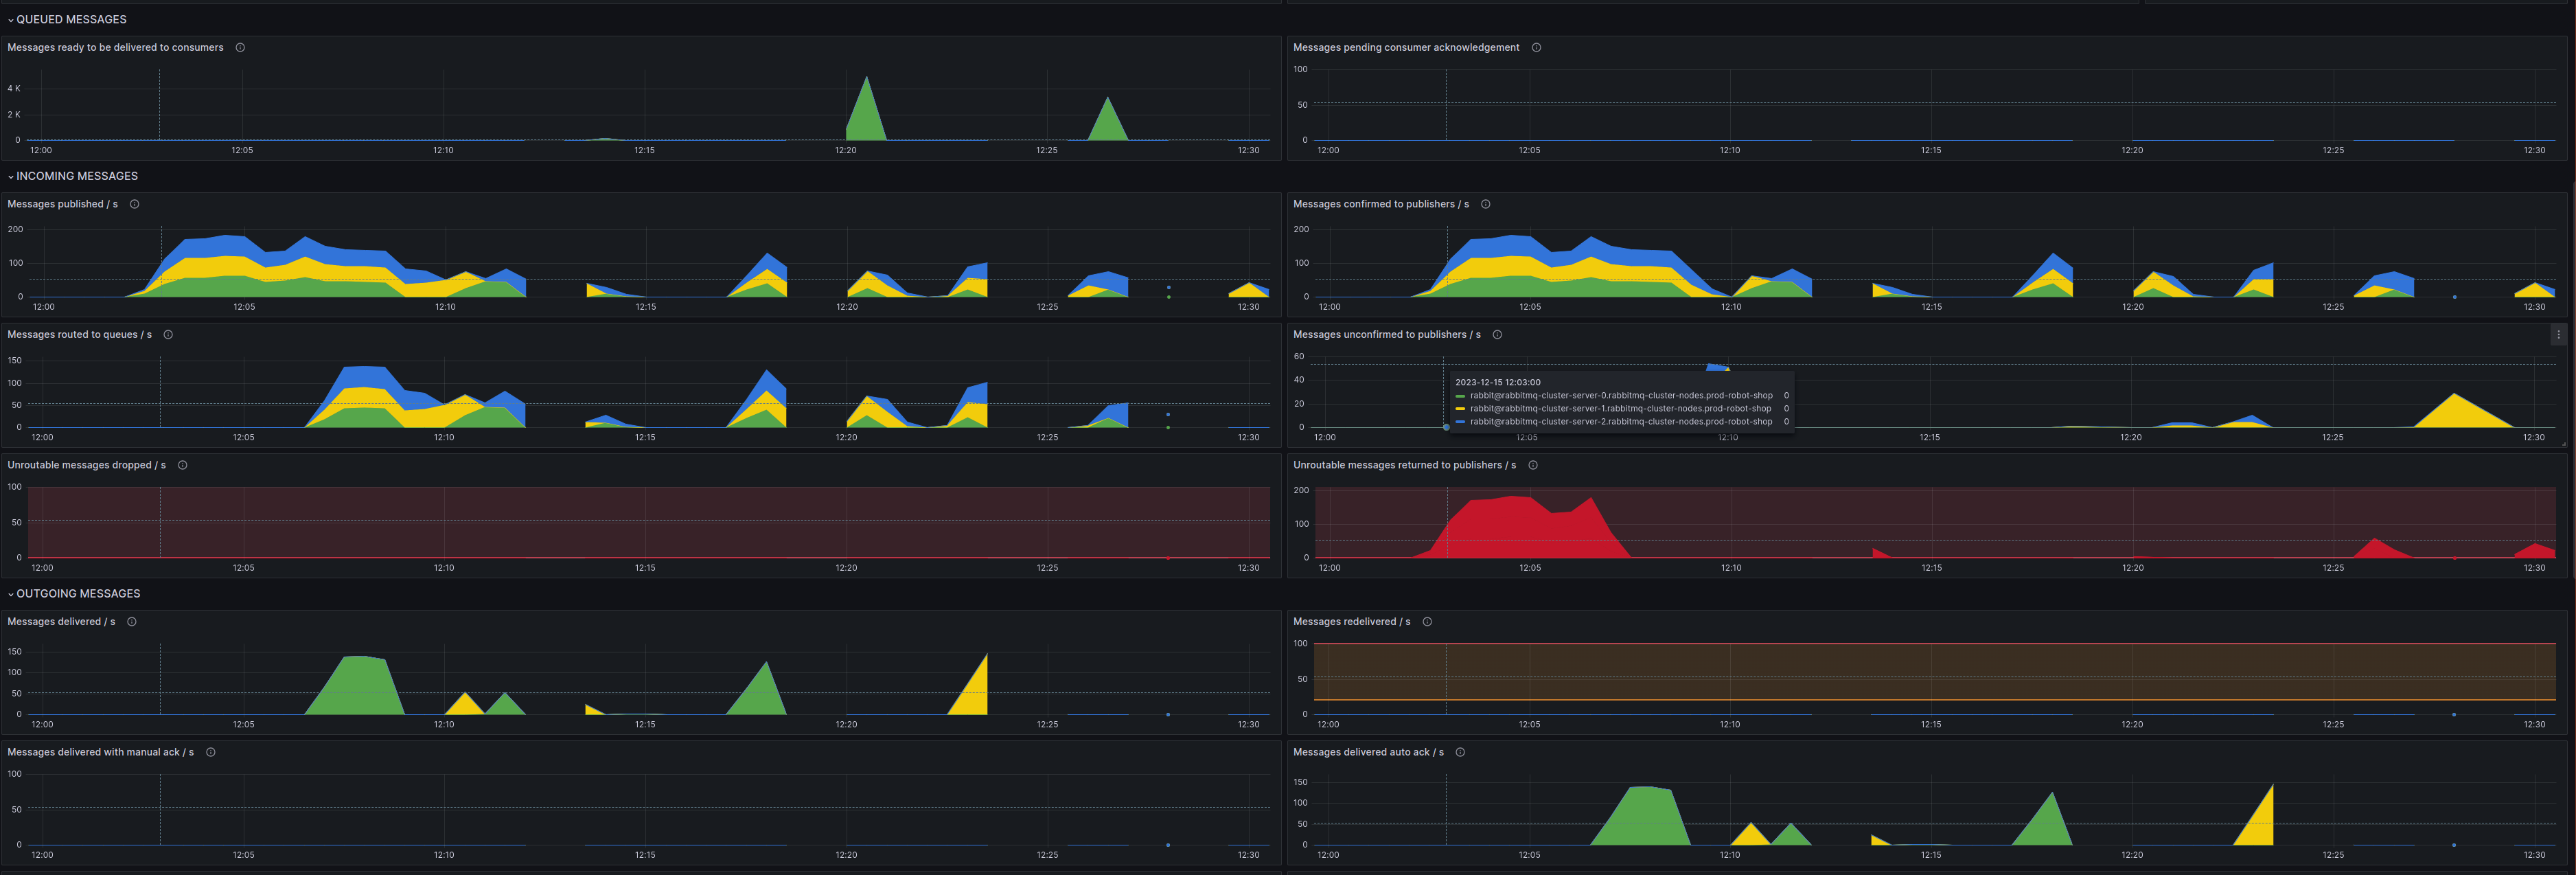
“Can’t we just scale up dispatch to consume the orders faster?” Carter was not in favor of his deadline getting stuck.
“We can deploy a quick event-driven autoscaler with KEDA. We should have had it in the first place, but this subsystem had never been required to deal with scale spikes before.”
Thankfully KEDA operator was already part of the cluster, and all Robin had to do was create a ScaledObject manifest targeting the Dispatch ScaleUp event, based on the rabbitmq_global_messages_received_total metric from Prometheus.
apiVersion: keda.sh/v1alpha1
kind: ScaledObject
metadata:
  name: dispatch-scale-up
  namespace: robot-shop
spec:
  scaleTargetRef:
    kind: Deployment
    name: dispatch
  pollingInterval:  10
  cooldownPeriod:   300
  minReplicaCount: 3
  maxReplicaCount: 10
  advanced:
    restoreToOriginalReplicaCount: true
    horizontalPodAutoscalerConfig:
      behavior:
        scaleUp:
          stabilizationWindowSeconds: 0
          policies:
          - type: Pods
            value: 1
            periodSeconds: 1
  triggers:
  - type: prometheus
    metadata:
      serverAddress: http://prometheus-stack-kube-prom-prometheus.monitoring.svc.cluster.local:9090
      query: |
        sum(rate(rabbitmq_global_messages_received_total[60s]))
      threshold: '10'

“Dispatch has scaled up, it’ll keep adding more pods if the number of orders published to the queue goes beyond a threshold of 10 messages,” Robin said.
“Let’s wait a few minutes and see if scaling consumers would resolve the issue,” Blake commented.

“This doesn’t look like a fix.” Blake pointed at the memory consumption and connections per pod metric, “See here, this is not about scaling up the consumers. RabbitMQ pods are unable to handle that many connections, given how little memory we have allocated to them. Can we use KEDA to scale up the RabbitMQ statefulset?”
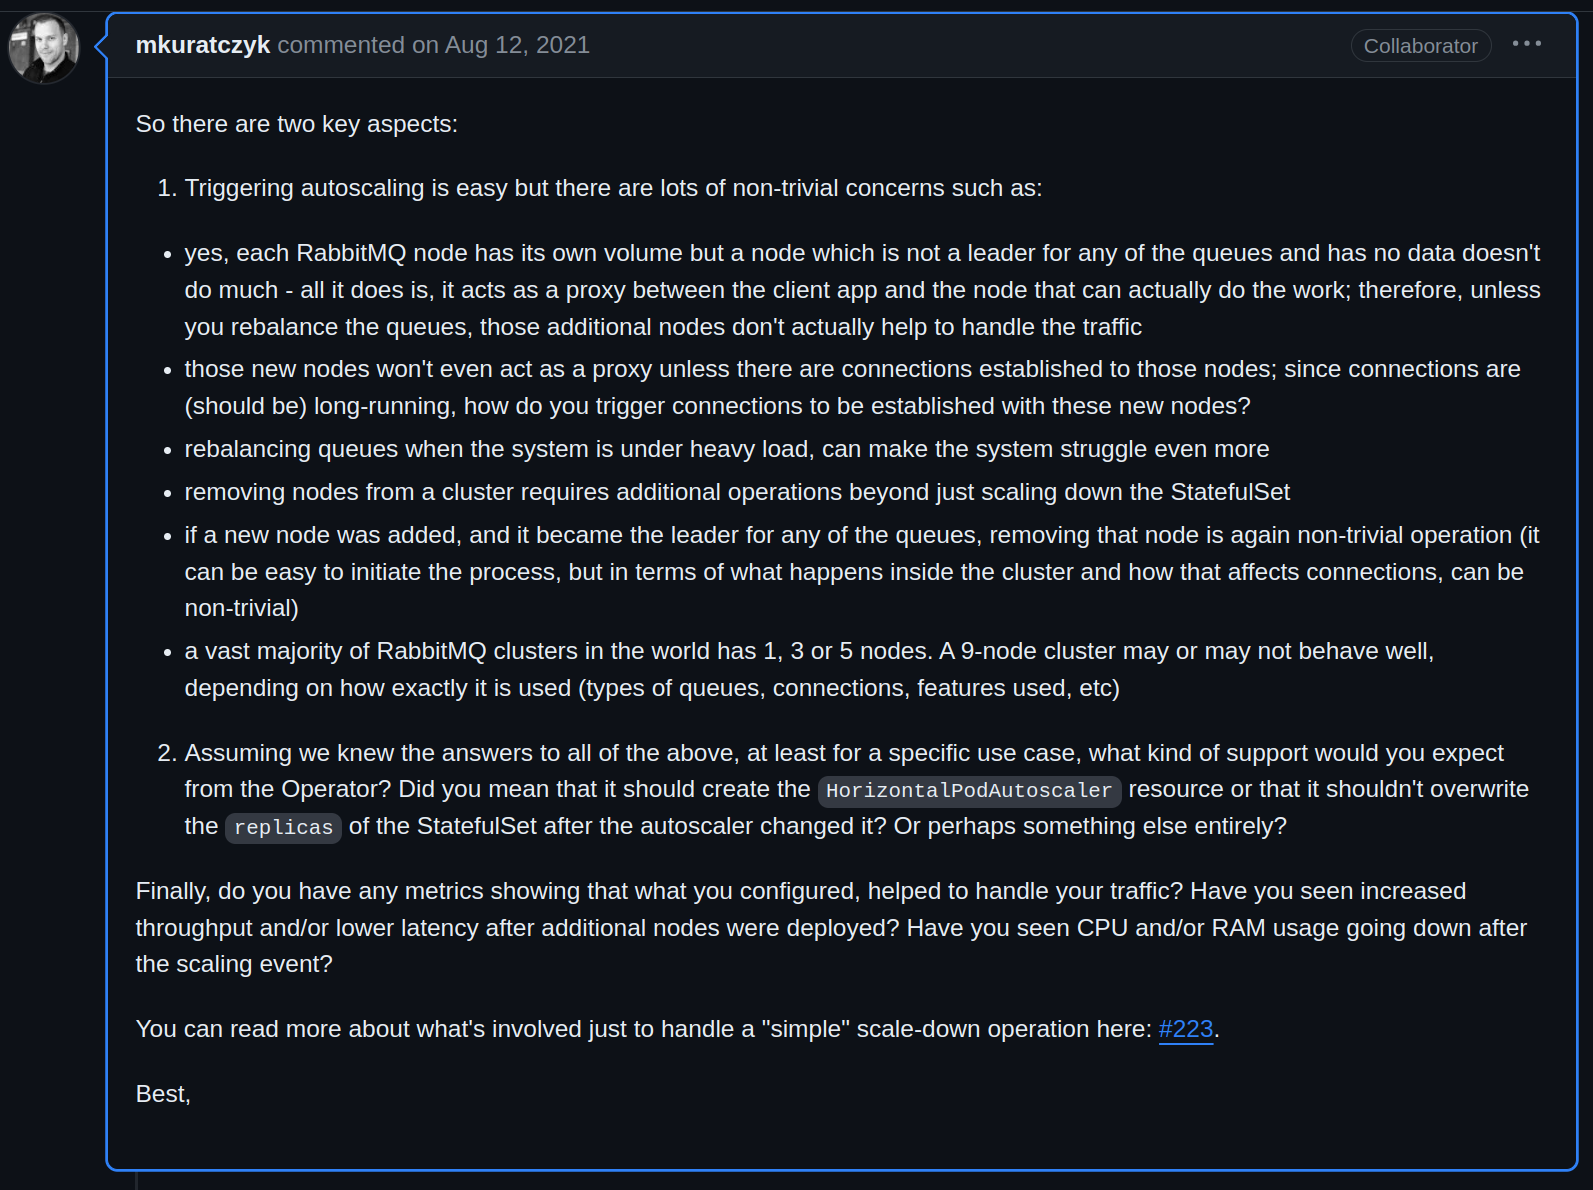
“We are using RabbitMQ Operator, not sure if they allow autoscaling. They might wrap a HorizontalPodAutoscaler resource within the operator itself!” Robin shrugged. They started digging into the problem.
(Add Support For Pods Auto Scaling)
“Doesn’t look like it. The maintainers do not recommend auto-scaling RabbitMQ for legitimate reasons and cap the scale at 9 nodes or pods. Let’s just manually scale up for now. I’m going to scale them up vertically too after the new nodes are up, and add more memory per node.”
export RMQ_CLUSTER_NS=robot-shop
kubectl patch rabbitmqcluster rabbitmq-cluster --type='json' \
    -p='[
        {"op": "replace", "path": "/spec/replicas", "value": 6},
        {"op": "replace", "path": "/spec/resources/limits/memory", "value": "400Mi"},
        {"op": "replace", "path": "/spec/resources/requests/memory", "value": "100Mi"},
        ]' \
     -n $RMQ_CLUSTER_NS
“The new nodes will take a few seconds to start accepting connections, also we are not using mirrored or quorum queues. This was thought to be a small workload and we decided a simple direct queue would suffice. The cluster was not modeled for spikey loads such as today’s.”

“If we are going to run spikey workloads like this on the queueing infrastructure, we need to benchmark for them and publish those benchmarks cross-team, else they would not know whether or not a certain infrastructure is resilient enough. Also, the teams need to communicate ahead of time before running auxiliary Biz team workloads like this with the Infrastructure team in the loop,” Blake thought.
“Clock the RCA time, Robin,” Blake said.
“5 minutes tops. We handled this before it could get out of hand.” Robin replied.
It was fast troubleshooting, and payments were back online as the upgraded cluster handled the increased publisher count due to pending orders and live payments.
Key takeaways
Many incidents occur in sufficiently complex scenarios when underlying infrastructure is not optimally benchmarked. Benchmarking is the first step towards optimal capacity planning. Base infrastructure like cache, queue, and databases need to be tested for seasonal rise and fall of traffic but also be resilient enough for sudden unplanned traffic spikes; whether initiated by customers or internal needs like batched jobs or analytics.
During the above incident, the team found that:
-
Communication broke down between the business and tech/infra teams.
- The business team was unaware whether or not the underlying infra could sustain a sudden spike of 400-500 concurrent jobs, up from the standard 20-30 payments per minute.
- The business team never communicated with the infrastructure team about running a new workload.
-
There was no internally published benchmark or SLI (service level indicator) that informed other teams of the capabilities of the systems their work relied on.
- The infrastructure team did not have enough policy-oriented safeguards on production infrastructure so that un-sanctioned workloads could not be side-loaded without their knowledge.
- The queue infrastructure and consumers were not configured with event-driven auto-scaling to respond to traffic and connection spikes.
- Enough in-depth exploration of the elasticity and scalability of RabbitMQ was not conducted. The team had assumed current publisher concurrency to stay consistent over time.
Open and transparent cross-team collaboration is key to running software efficiently and scalably in modern systems. Assumptions are almost always erroneous unless confidence is built around them with proper benchmarking of infrastructure. Systems sometimes have implicit limitations that make them unsuitable for specific types of workloads.
Author’s note
Hope you all enjoyed that story about a hypothetical troubleshooting scenario. We see incidents like this and more across various clients we work with at InfraCloud. The above scenario can be reproduced using our open source repository.
We are working on adding more such reproducible production outages and subsequent mitigations to this repository.
We would love to hear from you about the incidents where your knowledge of queueing theory came in handy. What is the largest deployment of RabbitMQ you have run?
If you have any questions, you can connect with me on Twitter or LinkedIn.
References
Stay updated with latest in AI and Cloud Native tech
We hate 😖 spam as much as you do! You're in a safe company.
Only delivering solid AI & cloud native content.


