
Running Phi 3 with vLLM and Ray Serve

While everyone is talking about new models and their possible use cases, their deployment aspect often gets overlooked. The journey from a trained model to a production-ready service is a complex and nuanced process that deserves more attention. From the perspective of a web API server, when a developer needs to access information like user profiles or services, we typically create a REST API service that interacts with the database. This API service also handles business logic, enabling the system to process and serve thousands of requests per minute efficiently. However, it is different when we talk about serving models.
In the pre-production phase, data scientists and machine learning (ML) engineers often test their models locally, loading model weights onto a Compute Unified Device Architecture (CUDA) device using ML libraries like PyTorch to showcase accuracy. While this local execution works excellently for testing, scaling that same model to handle real-time, production-level traffic is an entirely different challenge. Many engineers consider serving the model by wrapping it in a Flask microservice. Though the Flask microservice is a simple solution, it quickly becomes unmanageable when dealing with multiple models and serving on a scale.
Additionally, monitoring the performance of a model in production is quite different from monitoring the performance of traditional API servers. Inference requires specialized monitoring for aspects like latency, GPU utilization, and throughput—less relevant metrics for typical API services. This is where inference servers come into play and provide specialized servers for model serving.
In this blog post, we will delve into the differences between inference and serving and explore how to deploy the Phi-3 model using vLLM with Ray Serve on Kubernetes, a general-purpose scalable serving layer built on top of Ray.
Inference and Serving
Before diving into the details of inference and serving, it’s important to understand how they fit into the broader MLOps cycle. MLOps, or Machine Learning Operations, is a set of practices that aim to automate and streamline the process of deploying and maintaining machine learning models in production. It draws parallels to DevOps but specifically focuses on the challenges unique to machine learning.
The MLOps cycle typically involves several stages, from data collection and model development to deployment, monitoring, and continuous improvement. If you’re new to the concept, I recommend checking out our detailed introduction to MLOps for a comprehensive overview.
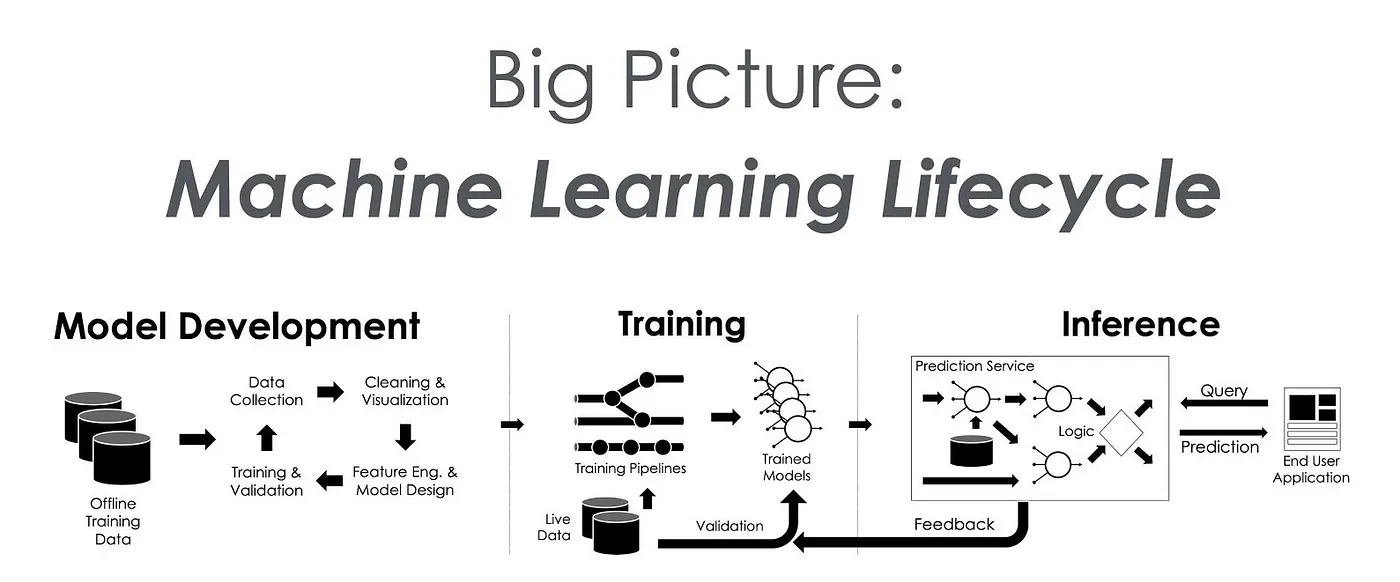
In this cycle, inference and serving come into play in the latter half once a model has been trained and is ready for deployment. Though these terms are often used interchangeably, they refer to different stages in the lifecycle of a model in production.
What is inference?
Inference is when a trained model takes input data and produces predictions or outputs. In simpler terms, the actual computation happens when a model is asked to generate a result—like classifying an image, translating text, or generating a response in a chatbot. Inference happens locally when testing the model, often using a framework like PyTorch or TensorFlow, and can be run on either CPUs or GPUs.
What is model serving?
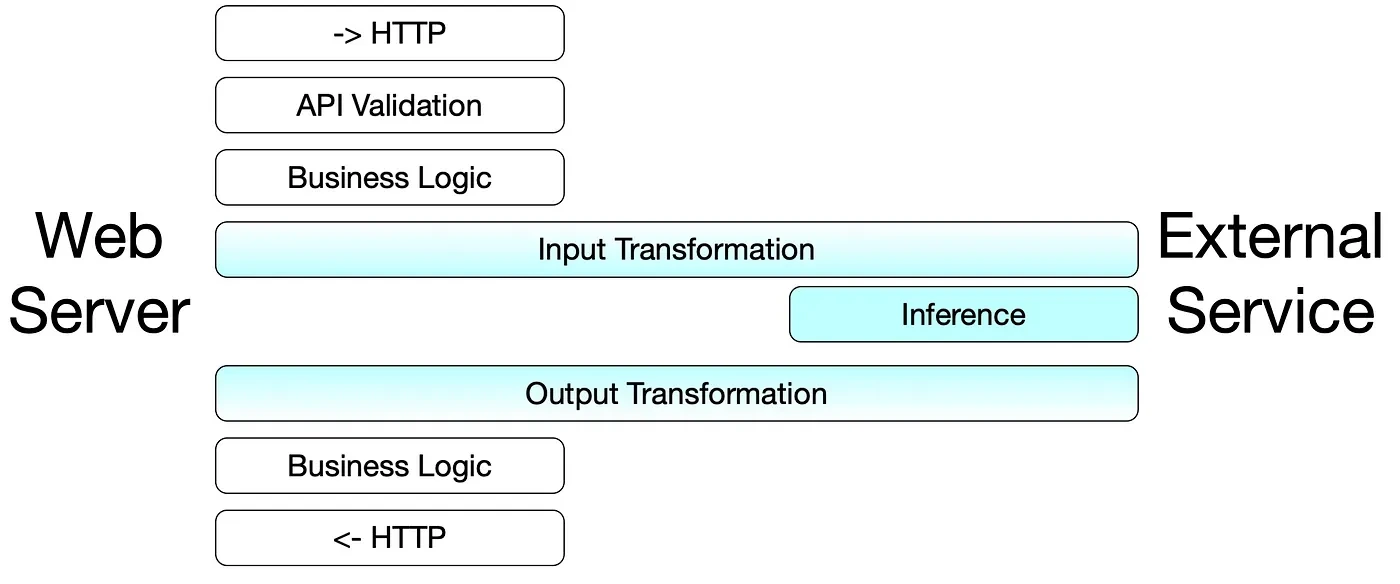
Serving, on the other hand, refers to making the model accessible as a service. This involves deploying the model in a way that allows it to handle real-time requests, often at scale. When a model is served, it’s not just about running inference but doing so in an optimized, scalable, and monitored environment where it can respond to multiple requests from users or applications in real time. Serving requires integrating the model with APIs, managing resources like GPU/CPU, and ensuring the service is stable and performant over time.
Since we’re talking about deploying Phi-3, a large language model, we will take a look at specialized servers that allow us to deploy LLMs. Some of them are:
- vLLM: This works as an inference engine and an inference server, allowing you to run LLMs that are supported by it.
- Ray Serve: It is a framework-agnostic serving library, and enables you to use the same framework you trained your model in, reducing the need to convert to a specific format.
- TensorRT LLM: It is a specialized inference server for TensorRT-trained models, or to run any other model, you would need to convert into the format that TensorRT LLM supports.
In the scope of this blog, we will be using vLLM as an inference engine, and Ray Serve as a serving library. You can read more about inference servers in our blog post, where we explored AI Model Inference: servers, frameworks, and optimization strategies for detailed understanding.
What is vLLM?
vLLM stands for virtual large language models. It is one of the open source fast inferencing and serving libraries. As the name suggests, ‘virtual’ encapsulates the concept of virtual memory and paging from operating systems, which allows addressing the problem of maximum utilization of resources and providing faster token generation by utilizing PagedAttention. Traditional LLM serving involves storing large attention keys and value tensors in GPU memory, leading to inefficient memory usage.
LMSYS, or Large Model Systems Organization, adopted vLLM to power Chatbot Arena and Vicuna Demo, handling significantly significant traffic and reducing operational costs.
Why vLLM?
vLLM is a specialized and efficient library for large language models (LLMs) with several advantages:
- Open source and highly adaptable: It’s an open source library, making it flexible and accessible for various use cases.
- Broad model support: It supports a wide range of model architectures, which you can explore further in the official vLLM documentation..
- Advanced monitoring and GPU support:
- Compatible with multiple GPU platforms, such as NVIDIA and AMD GPUs.
- Includes monitoring capabilities to track and manage model performance.
- Scalability: vLLM comes with built-in scaling mechanisms to handle large models effectively, such as tensor parallelism, pipeline parallelism, and distributed inference.
- Lightweight: Despite its powerful features, vLLM remains a lightweight library, making it a strong choice for efficient performance.
- Constantly improving: The toolkit continually evolves, with frequent updates and new features added.
For the purpose of this blog, we’ll be using vLLM specifically for the inference phase. Next, let’s see how Ray Serve fits into the picture.
Where does Ray Serve and KubeRay fit in Kubernetes?
Ray is an open source unified framework for AI and Python applications built around the idea of simplified distributed computing. It allows users to run tasks in parallel across multiple nodes or machines, making it ideal for distributed machine learning, reinforcement learning, or parallel processing. One of Ray’s standout features is its high-level libraries, one of them is Ray Serve, designed to streamline model serving for machine learning applications. You can learn in detail in Primer on Distributed Parallel Processing with Ray blog post.
Ray Serve
As we discussed, the serving model differs from traditional web servers. So now, when we have specialized model servers, like TensorFlow, ONNX Runtime, TensorRT, etc, they package existing models and serve them in their APIs. These model servers need more flexibility due to their specialized APIs. A developer or data scientist must deal with two servers: a model and a web server containing the business logic. Also, not to forget about vendor lock-in and conversion we have to do to serve them on those servers, adding a step in the process.
This is where Ray Serve helps. It allows you to contain business logic and model inference in the same place, with end-to-end control over the request lifecycle while letting each model scale independently. It supports multi-model serving, traffic splitting, and version control, enabling developers to route requests to specific models or model versions.
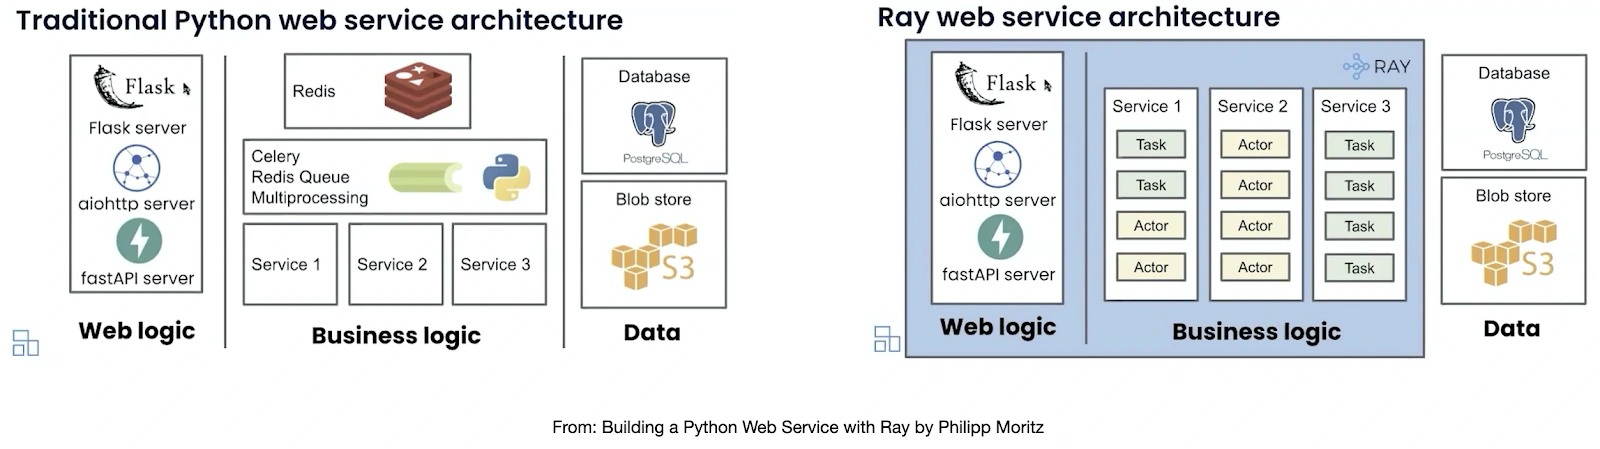
Ray Serve’s integration with Ray’s distributed framework allows models to be served without having to rewrite the entire application. The Ray Serve library also gets the features that Ray framework provides, such as easily scaling to many machines and flexible scheduling support, such as fractional GPUs, which in turn lowers the operation cost. You can read more about Ray Serve key concepts and features & use cases.
KubeRay
KubeRay enables you to run Ray applications on Kubernetes since Ray Serve deployments and applications are more like Ray Applications. KubeRay helps deploy such applications using Custom Resource Definitions.
It includes three CRDs:
- RayCluster: Manages the lifecycle of Ray clusters, specifying the configuration for head and worker nodes and resource allocation.
- RayService: This is designed specifically for managing Ray Serve deployments, providing a simple way to configure and deploy serving applications on Ray.
- RayJob: Allows users to run batch jobs on Ray, enabling the execution of distributed tasks and workflows within Kubernetes.
For a more detailed exploration of Ray and its capabilities, refer to my previous blog on Ray on Kubernetes using KubeRay.
So, what we’re more interested in the scope of this blog is RayService CRD.
RayService
The RayService CRD allows you to deploy Ray Serve applications seamlessly on Kubernetes. By defining a RayService, you can specify your Ray Serve deployment’s parameters, such as the model to be served, scaling options, and routing configurations. This abstraction simplifies the deployment process and allows you to manage your serving infrastructure through Kubernetes.
Example of a RayService CRD:
apiVersion: serving.kubray.io/v1alpha1
kind: RayService
metadata:
  name: audio-model
spec:
  rayCluster: my-ray-cluster
  deployment:
    replicas: 3
    model: AudioModel
    routePrefix: "/audio"
In this example, the RayService CRD defines a deployment for the AudioModel, specifying that three replicas should be created to handle incoming requests at the /audio endpoint. This structure simplifies the deployment and integrates with Kubernetes’ existing capabilities.
Serving Model on Kubernetes
In this implementation, we will be deploying phi-3-mini-4k-instruct model by Microsoft using vLLM as an inference engine and Ray Serve for serving with the help of KubeRay on Kubernetes.
Prerequisites
To get this working, we will need the following things beforehand.
- kubectl: Make sure you have kubectl installed on your local system.
- Kubernetes Cluster: It should have at least two worker nodes with 1 CPU node and 1 GPU node.
- Make sure the GPU node is tainted.
- Ray Serve library (optional): It is not required per se, but for local testing, it should be present.
- Helm: It will be used for installing charts.
Setting up
-
Install KubeRay via Helm on Kubernetes.
helm repo add kuberay https://ray-project.github.io/kuberay-helm/
helm repo update
helm install kuberay-operator kuberay/kuberay-operator --version 1.2.1Output:
NAME: kuberay-operator LAST DEPLOYED: Fri Sep 20 07:44:00 2024 NAMESPACE: default STATUS: deployed REVISION: 1 TEST SUITE: None -
Now, create a Ray Serve application. We will wrap the deployment and serve in the same Python Class, VLLMInference. The vLLM engine will be created during initialization, and the tokenizer will be loaded. Upon getting a request on the REST API endpoint /generate, it will use the vLLM-provided chat template and pass the prompt self.engine.generate, which will queue the request if other requests are still being processed. Lastly, the Custom GenerateResponse PyDantic model will revert responses in a specified format.
@serve.deployment(name='VLLMInference',
                num_replicas=1,
                max_concurrent_queries=256,
                ray_actor_options={"num_gpus": 1.0}
                )
@serve.ingress(app)
class VLLMInference:
    def __init__(self, **kwargs):
        super().__init__(app)
        self.args = AsyncEngineArgs(**kwargs)
        self.engine = AsyncLLMEngine.from_engine_args(self.args)
        self.tokenizer = self._prepare_tokenizer()


    def _prepare_tokenizer(self,):
        from transformers import AutoTokenizer
        if self.args.trust_remote_code:
            tokenizer = AutoTokenizer.from_pretrained(self.args.model, trust_remote_code=True)
        else:
            tokenizer = AutoTokenizer.from_pretrained(self.args.model)
        return tokenizer


    @app.post("/generate", response_model=GenerateResponse)
    async def generate_text(self, request: GenerateRequest, raw_request: Request) -> GenerateResponse:
        logging.info(f"Received request: {request}")
        try:
            generation_args = request.dict(exclude={'prompt', 'messages'})
            if generation_args is None:
                # Default value
                generation_args = {
                    "max_tokens": 500,
                    "temperature": 0.1,
                }

            if request.prompt:
                prompt = request.prompt
            elif request.messages:


                prompt = self.tokenizer.apply_chat_template(
                    request.messages,
                    tokenize=False,
                    add_generation_prompt=True
                )
            else:
                raise ValueError("Prompt or Messages is required")


            sampling_params = SamplingParams(**generation_args)


            request_id = self._next_request_id()

            results_generator = self.engine.generate(prompt, sampling_params, request_id)


            final_result = None
            async for result in results_generator:
                if await raw_request.is_disconnected():
                    await self.engine.abort(request_id)
                    return GenerateResponse()
                final_result = result  # Store the last result
            if final_result:
                return GenerateResponse(output=final_result.outputs[0].text,
                                        finish_reason=final_result.outputs[0].finish_reason,
                                        prompt=final_result.prompt)
            else:
                raise ValueError("No results found")
        except ValueError as e:
            raise HTTPException(HTTPStatus.BAD_REQUEST, str(e))
        except Exception as e:
            logger.error('Error in generate()', exc_info=1)
            raise HTTPException(HTTPStatus.INTERNAL_SERVER_ERROR, 'Server error')


    @staticmethod
    def _next_request_id():
        return str(uuid.uuid1().hex)


    async def _abort_request(self, request_id) -> None:
        await self.engine.abort(request_id)


    @app.get("/health")
    async def health(self) -> Response:
        """Health check."""
        return Response(status_code=200)

def deployment_llm(args: Dict[str, str]) -> Application:
    return VLLMInference.bind(**args)
Once the Ray Serve application is ready, push it to the repository.
-
Now, let’s define RayService CRD.
This CRD will help us deploy our Ray Serve application on Kubernetes and configure scaling and other Kubernetes-related parameters.
Here, I’m providing a name and route, import path, and the location of the binding function within the working directory (i.e., our GitHub repository). I’m also providing a few args accepted by the Ray Serve application.
These args are helpful in the long run if you want to customize or change any parameter. We won’t have to rewrite the whole application; the same CRD with different names and args can be used for various models if supported.
apiVersion: ray.io/v1
kind: RayService
metadata:
  name: vllm-service
spec:
  serveConfigV2: |
    applications:
      - name: VLLMService
        route_prefix: /
        import_path: ray-serve.vllm_engine:deployment_llm
        runtime_env:
          working_dir: "https://github.com/infracloudio/ray-serve-demo/archive/28e409b87d2618cdb6f1a2f9f618b66ca896747e.zip"
          pip: [ "git+https://github.com/huggingface/transformers", "pydantic", "vllm", "fastapi", "requests"]
        args:
          model: microsoft/Phi-3-mini-4k-instruct
          trust_remote_code: true
          dtype: float16
  rayClusterConfig:
    rayVersion: '2.30.0' # Should match the Ray version in the image of the containers
    ######################headGroupSpecs#################################
    # Ray head pod template.
    headGroupSpec:
      # The `rayStartParams` are used to configure the `ray start` command.
      # See https://github.com/ray-project/kuberay/blob/master/docs/guidance/rayStartParams.md for the default settings of `rayStartParams` in KubeRay.
      # See https://docs.ray.io/en/latest/cluster/cli.html#ray-start for all available options in `rayStartParams`.
      rayStartParams:
        dashboard-host: '0.0.0.0'
      # Pod template
      template:
        spec:
          containers:
          - name: ray-head
            image: rayproject/ray-ml:2.30.0
            ports:
            - containerPort: 6379
              name: gcs
            - containerPort: 8265
              name: dashboard
            - containerPort: 10001
              name: client
            - containerPort: 8000
              name: serve
            volumeMounts:
              - mountPath: /tmp/ray
                name: ray-logs
            resources:
              limits:
                cpu: "2"
                memory: "8G"
              requests:
                cpu: "2"
                memory: "8G"
            # Do not enable if the monitoring stack is not there
            # env:
            # - name: RAY_GRAFANA_IFRAME_HOST
            #   value: http://127.0.0.1:3000
            # - name: RAY_GRAFANA_HOST
            #   value: http://prometheus-grafana.prometheus-system.svc:80
            # - name: RAY_PROMETHEUS_HOST
            #   value: http://prometheus-kube-prometheus-prometheus.prometheus-system.svc:9090
          volumes:
            - name: ray-logs
              emptyDir: {}
    workerGroupSpecs:
    # The pod replicas in this group typed worker
    - replicas: 1
      minReplicas: 1
      maxReplicas: 1
      groupName: gpu-group
      rayStartParams: {}
      # Pod template
      template:
        spec:
          containers:
          - name: ray-worker
            image: rayproject/ray-ml:2.30.0
            resources:
              limits:
                cpu: 4
                memory: "16G"
                nvidia.com/gpu: 1
              requests:
                cpu: 3
                memory: "12G"
                nvidia.com/gpu: 1
          # Please add the following taints to the GPU node.
          tolerations:
            - key: "nvidia.com/gpu"
              operator: "Equal"
              value: "present"
              effect: "NoSchedule"
In the worker’s configuration, we have defined the limits, requests, and tolerations in a similar resource format as Kubernetes expects. Tolerations and taint are defined to prevent scheduling CPU-intensive resources on GPU nodes. So, only resources that request GPU and have toleration defined are scheduled on GPU nodes, thus avoiding resource waste.
Lastly, if you have a monitoring stack in the cluster, only enable the commented part in the Ray head configuration. The source code of the above RayService CRD and Ray Serve application can be found in this repository.
-
Deploying monitoring stack.
To deploy the monitoring stack, you can use these docs: Using Prometheus and Grafana. The KubeRay provides an install.sh script to install the Prometheus chart and related custom resources in the namespace prometheus-system automatically. If you don’t have an installed one, this will ease the process of setting up the monitoring stack.
To install, clone the ray-project/kuberay and checkout to master. Inside the local repo directory, run the below command.
 # Path: kuberay/
 ./install/prometheus/install.sh
Output:
$ kuberay git:(master) ./install/prometheus/install.sh
+ set errexit
+ helm repo add prometheus-community https://prometheus-community.github.io/helm-charts
"prometheus-community" already exists with the same configuration, skipping
+ helm repo update
Hang tight while we grab the latest from your chart repositories...
...Successfully got an update from the "metrics-server" chart repository
...Successfully got an update from the "kuberay" chart repository
...Successfully got an update from the "prometheus-community" chart repository
Update Complete. ⎈Happy Helming!⎈
+++ dirname ./install/prometheus/install.sh
++ cd ./install/prometheus
++ pwd
+ DIR=/home/sudhanshu/Desktop/workspace/ray-demo/kuberay/install/prometheus
+ helm --namespace prometheus-system install prometheus prometheus-community/kube-prometheus-stack --create-namespace --version 48.2.1 -f /home/sudhanshu/Desktop/workspace/ray-demo/kuberay/install/prometheus/overrides.yaml
NAME: prometheus
LAST DEPLOYED: Mon Sep 23 07:53:55 2024
NAMESPACE: prometheus-system
STATUS: deployed
REVISION: 1
NOTES:
kube-prometheus-stack has been installed. Check its status by running:
kubectl --namespace prometheus-system get pods -l "release=prometheus"

Visit https://github.com/prometheus-operator/kube-prometheus for instructions on how to create & configure Alertmanager and Prometheus instances using the Operator.
+ monitor_dir=/home/sudhanshu/Desktop/workspace/ray-demo/kuberay/install/prometheus/../../config/prometheus
+ pushd /home/sudhanshu/Desktop/workspace/ray-demo/kuberay/install/prometheus/../../config/prometheus
~/Desktop/workspace/ray-demo/kuberay/config/prometheus ~/Desktop/workspace/ray-demo/kuberay
++ ls
+ for file in `ls`
+ kubectl apply -f podMonitor.yaml
podmonitor.monitoring.coreos.com/ray-workers-monitor created
+ for file in `ls`
+ kubectl apply -f rules
prometheusrule.monitoring.coreos.com/ray-cluster-gcs-rules created
+ for file in `ls`
+ kubectl apply -f serviceMonitor.yaml
servicemonitor.monitoring.coreos.com/ray-head-monitor created
+ popd
~/Desktop/workspace/ray-demo/kuberay
Check all the resources for monitoring up and running.
$ kuberay git:(master) kubectl get all -n prometheus-system NAME READY STATUS RESTARTS AGE pod/alertmanager-prometheus-kube-prometheus-alertmanager-0 2/2 Running 0 114s pod/prometheus-grafana-54cddddd76-r8jqp 3/3 Running 0 2m2s pod/prometheus-kube-prometheus-operator-96f59f654-9vbxc 1/1 Running 0 2m2s pod/prometheus-kube-state-metrics-786fbd7c69-9xdtk 1/1 Running 0 2m2s pod/prometheus-prometheus-kube-prometheus-prometheus-0 2/2 Running 0 113s pod/prometheus-prometheus-node-exporter-77kkn 1/1 Running 0 2m2s pod/prometheus-prometheus-node-exporter-89dc5 1/1 Running 0 2m2s NAME TYPE CLUSTER-IP EXTERNAL-IP PORT(S) AGE service/alertmanager-operated ClusterIP None <none> 9093/TCP,9094/TCP,9094/UDP 115s service/prometheus-grafana ClusterIP 34.118.226.253 <none> 80/TCP 2m3s service/prometheus-kube-prometheus-alertmanager ClusterIP 34.118.231.161 <none> 9093/TCP,8080/TCP 2m3s service/prometheus-kube-prometheus-operator ClusterIP 34.118.234.87 <none> 443/TCP 2m3s service/prometheus-kube-prometheus-prometheus ClusterIP 34.118.236.54 <none> 9090/TCP,8080/TCP 2m3s service/prometheus-kube-state-metrics ClusterIP 34.118.232.116 <none> 8080/TCP 2m3s service/prometheus-operated ClusterIP None <none> 9090/TCP 114s service/prometheus-prometheus-node-exporter ClusterIP 34.118.225.149 <none> 9100/TCP 2m3s NAME DESIRED CURRENT READY UP-TO-DATE AVAILABLE NODE SELECTOR AGE daemonset.apps/prometheus-prometheus-node-exporter 2 2 2 2 2 kubernetes.io/os=linux 2m3s NAME READY UP-TO-DATE AVAILABLE AGE deployment.apps/prometheus-grafana 1/1 1 1 2m3s deployment.apps/prometheus-kube-prometheus-operator 1/1 1 1 2m3s deployment.apps/prometheus-kube-state-metrics 1/1 1 1 2m3s NAME DESIRED CURRENT READY AGE replicaset.apps/prometheus-grafana-54cddddd76 1 1 1 2m3s replicaset.apps/prometheus-kube-prometheus-operator-96f59f654 1 1 1 2m3s replicaset.apps/prometheus-kube-state-metrics-786fbd7c69 1 1 1 2m3s NAME READY AGE statefulset.apps/alertmanager-prometheus-kube-prometheus-alertmanager 1/1 115s statefulset.apps/prometheus-prometheus-kube-prometheus-prometheus 1/1 114s -
Now, deploying RayService.
Note: Update the monitoring part in the YAML configuration under the ray-head container env with the correct and uncomment values.
env:
- name: RAY_GRAFANA_IFRAME_HOST
  value: http://127.0.0.1:3000
- name: RAY_GRAFANA_HOST
  value: http://prometheus-grafana.prometheus-system.svc:80
- name: RAY_PROMETHEUS_HOST
  value: http://prometheus-kube-prometheus-prometheus.prometheus-system.svc:9090
To deploy, apply the YAML in the cluster.
kubectl apply -f vllm-service-phi-3-mini-4k.yamlOutput:
rayservice.ray.io/vllm-service createdIt will take some time to load the images since rayproject/ray-ml:2.30.0 image is oversized (you could try building a small image file using that one, as mentioned here)
-
Behind the scenes of RayService.
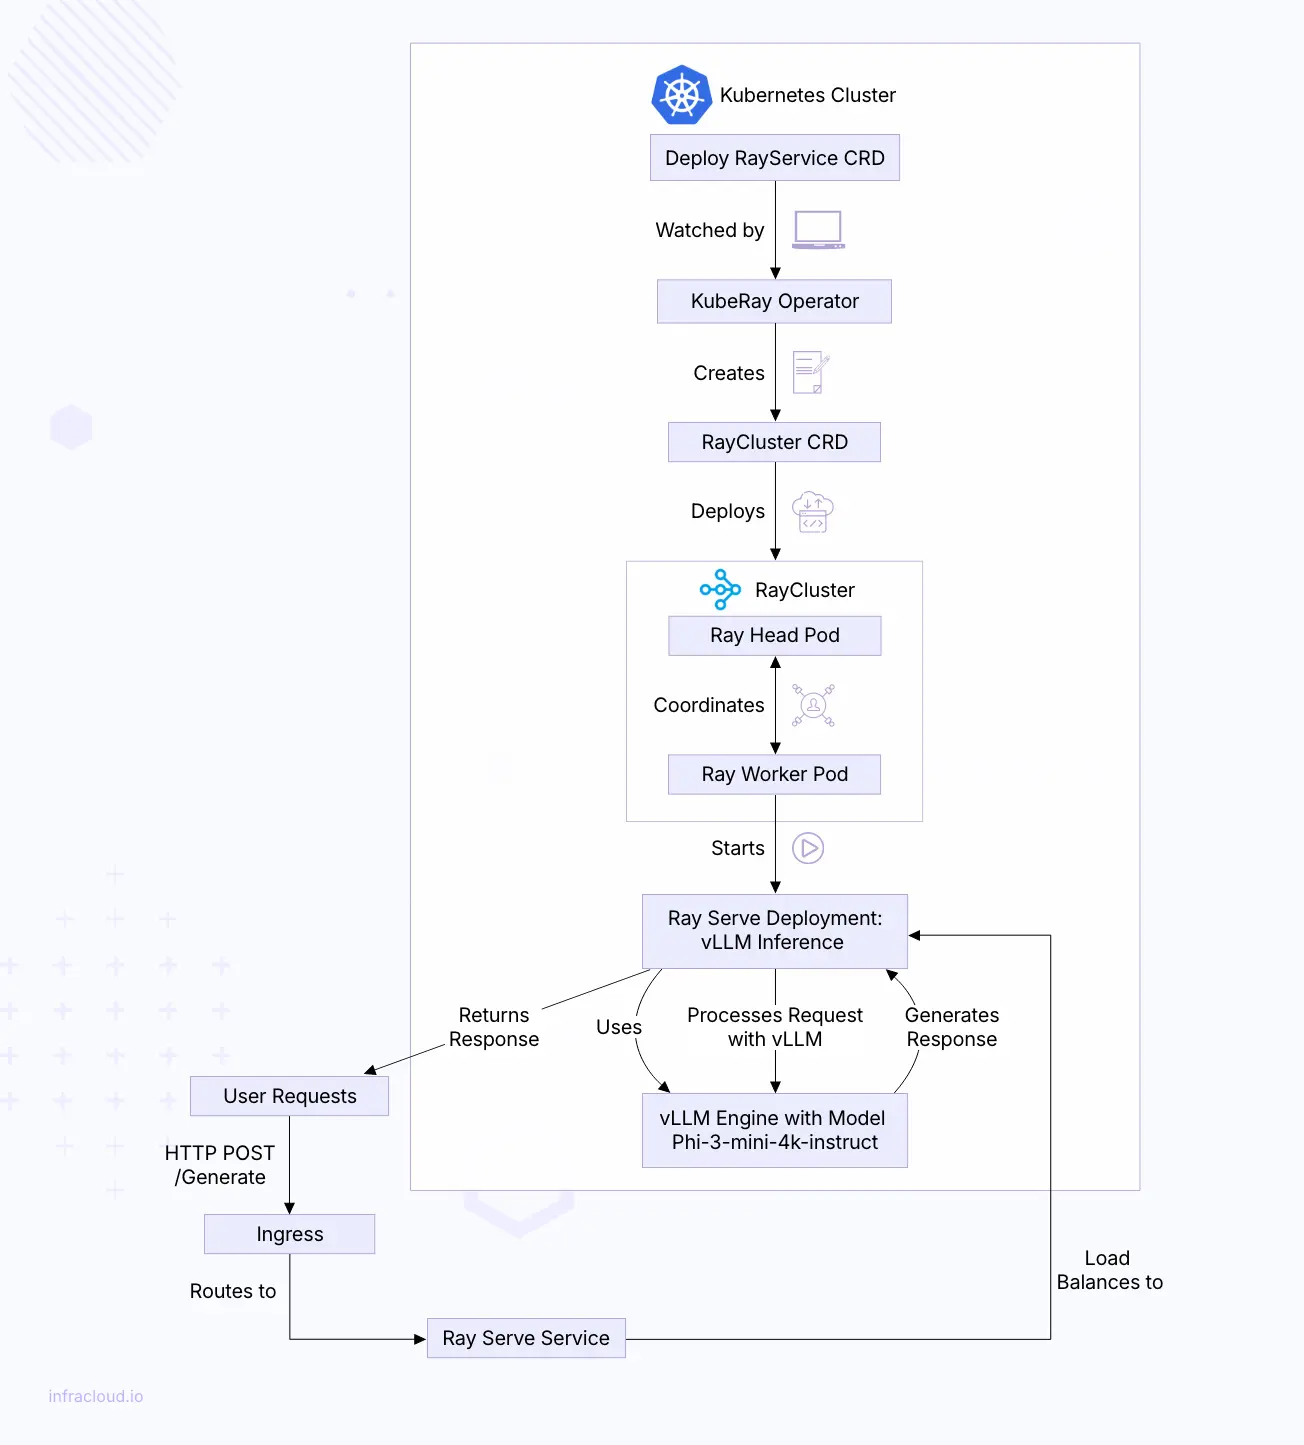
When you deploy a RayService CRD in your Kubernetes cluster, a coordinated series of events unfolds to set up your Ray cluster.
The process starts when Kubernetes accepts your RayService definition. The KubeRay operator, which monitors for such resources, notices the new CRD and kicks into action. It reads your specifications and translates them into a RayCluster CRD detailing how the head and worker nodes should be configured.
Next, the operator creates the necessary Kubernetes resources:
- Deployments for the Ray head node.
- ReplicaSets and Pods for the worker nodes, matching the number of replicas you’ve specified. If your configuration includes scaling, the operator adjusts the number of worker replicas based on workload demands through manual settings or Ray’s autoscale.
- Services to enable communication between nodes.
- Ingress resources if external access is needed.
Kubernetes schedules these pods onto cluster nodes, considering resource requests and any scheduling rules we’ve set, like node affinities or tolerations. The Ray head node initializes the cluster as the pods come online and worker nodes connect.
Ray actors—stateful work units—are scheduled across the worker nodes within the cluster. Ray’s internal scheduler handles this, optimizing resource availability and workload distribution.
Upon changes to RayService CRD spec by us, the operator will deploy new pods with the updated settings and gradually shift traffic to them, ensuring no downtime. Old pods are cleaned up once the new ones are running smoothly.
-
Ray Dashboard.
Once deployed, you can view the Ray Serve and all its related Actors in the Ray Dashboard, which will be available to forward Ray head service to local port 8265.
kubectl port-forward svc/vllm-service-head-svc 8265:8265To directly see the metrics scraped by Prometheus and embedding Grafana visualizations in the Ray Dashboard, you would need to port-forward Grafana service.
kubectl port-forward deployment/prometheus-grafana -n prometheus-system 3000:3000Note: The admin password is listed in the values.yaml inside kuberay/install/prometheus/overrides.yaml.
Once you open the Grafana, you should load the Grafana dashboard from the KubeRay preset inside the KubeRay repo, kuberay/config/grafana directory. We are importing serve_deployment_grafana_dashboard.json in Grafana, which looks like below:
-
Sending API requests to deployed model.
Send a request to deployed LLM model inference server. To do that, you would need to port-forward the service on local port 8000
kubectl port-forward svc/vllm-service-serve-svc 8000Now, send the curl request from the terminal or Postman application, whichever suits you the best.
curl --location --request POST 'http://127.0.0.1:8000/generate' \
--header 'Content-Type: application/json' \
--data-raw '{
   "prompt": "<|user|>\n<|user|>\n What are Large Language Models?<|end|>\n<|assistant|>",
   "messages": [],
   "max_tokens": 500,
   "temperature": 0.1
}'
Here, the number of tokens to be generated is 500 and temperature is set to 0.1, you can change it if you like and play around with it to reach optimal value.
Sending multiple messages/chat format
To send multiple messages similar to chat conversations with history as context, you could use the below curl.
curl --location --request POST 'http://127.0.0.1:8000/generate' \
--header 'Content-Type: application/json' \
--data-raw '{
    "prompt": "",
    "messages": [
        {
            "role": "user",
            "content": "Can you provide ways to eat combinations of bananas and dragonfruits?"
        },
        {
            "role": "assistant",
            "content": "Sure! Here are some ways to eat bananas and dragonfruits together: 1. Banana and dragonfruit smoothie: Blend bananas and dragonfruits together with some milk and honey. 2. Banana and dragonfruit salad: Mix sliced bananas and dragonfruits together with some lemon juice and honey."
        },
        {
            "role": "user",
            "content": "What about solving an 2x + 3 = 7 equation?"
        }
    ],
    "max_tokens": 500,
    "temperature": 0.1
}'
Monitoring model performance
With Ray Dashboard
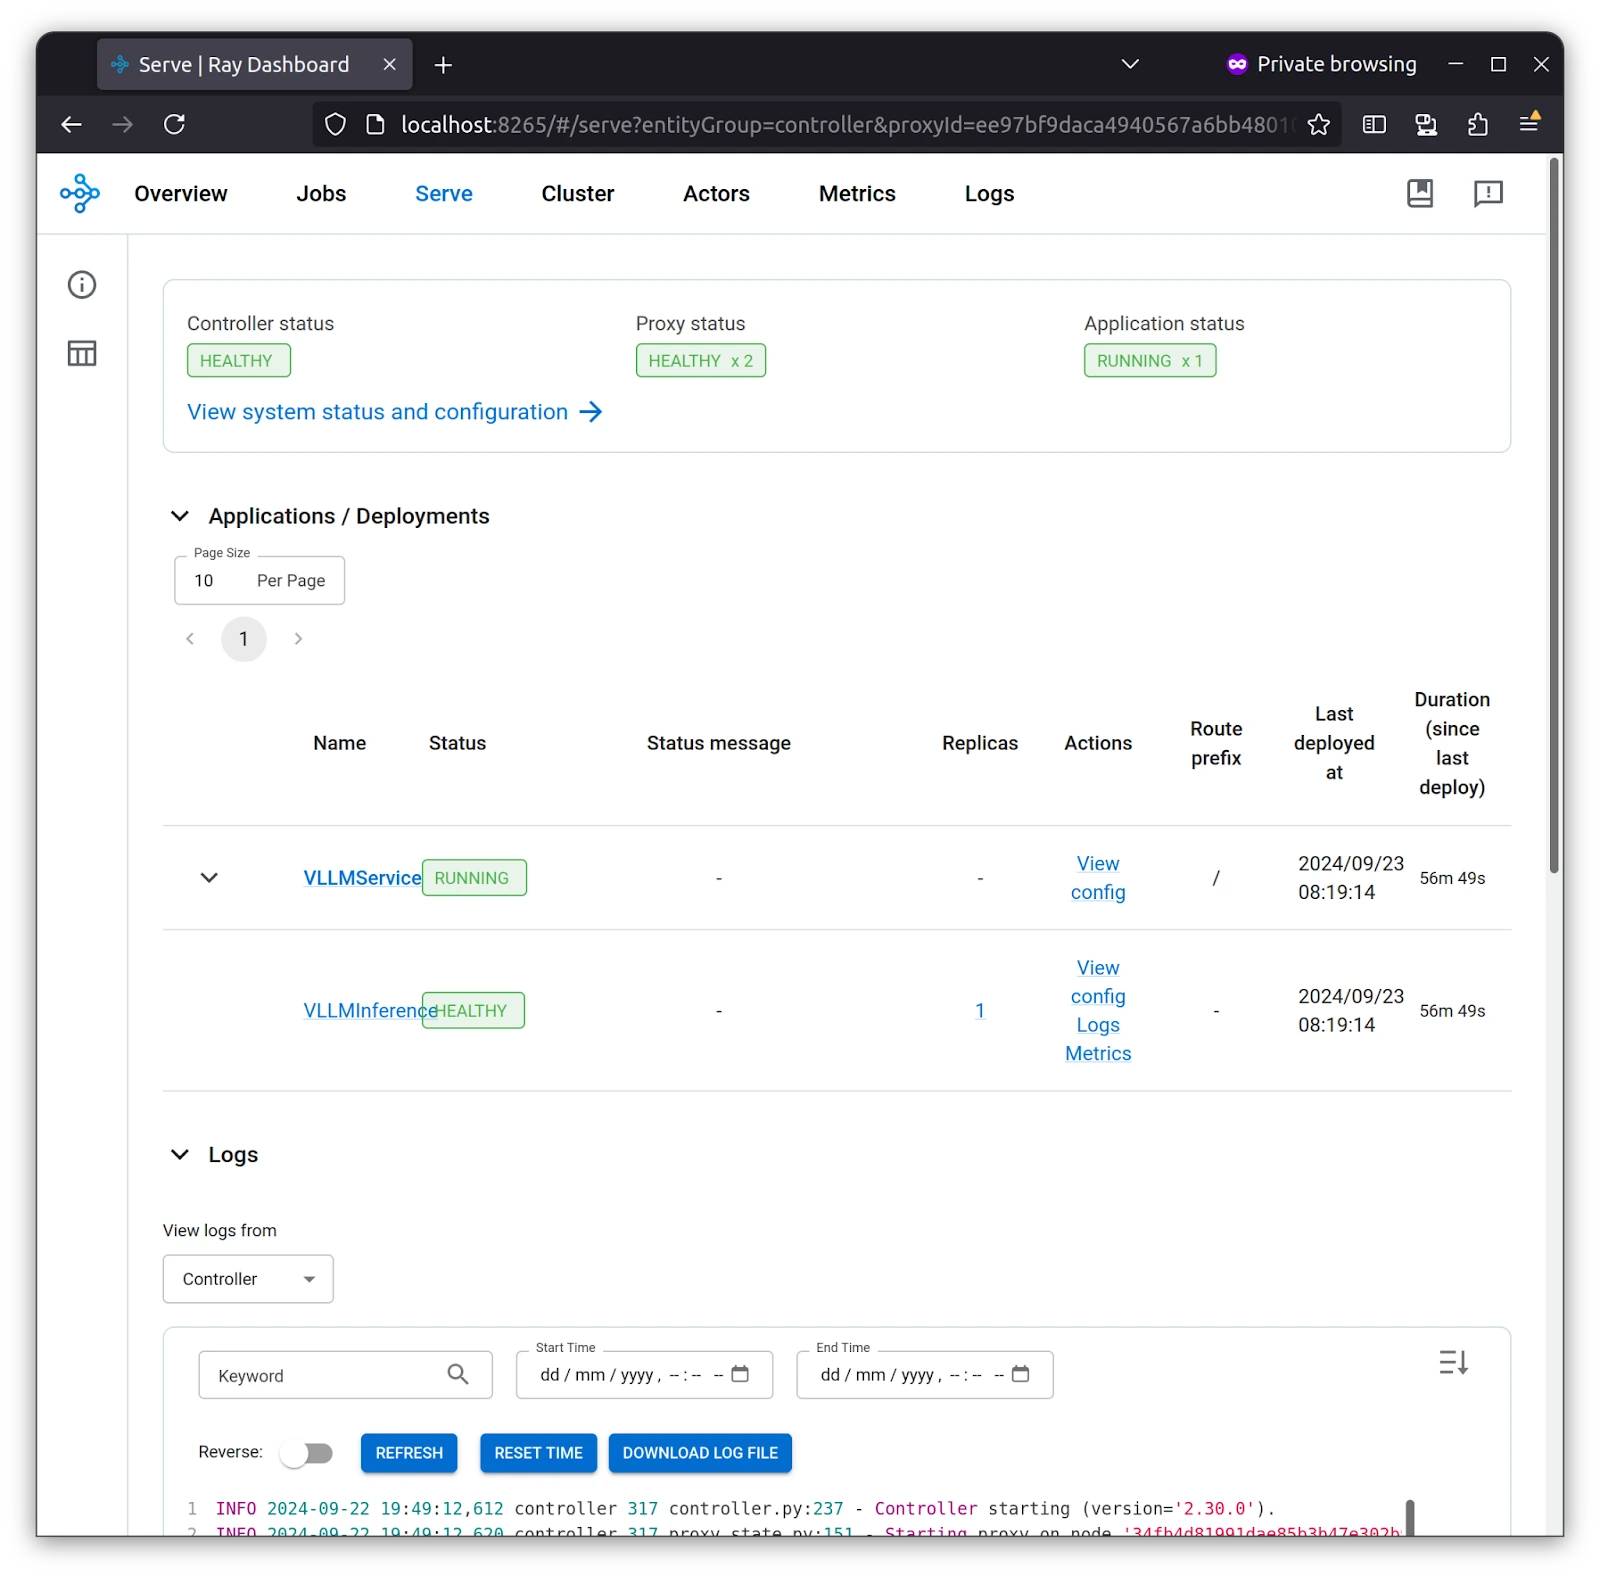
Ray Dashboard serves as a comprehensive monitoring tool for Ray clusters, providing live updates on service health, application deployments, resource consumption, and node-level diagnostics, which are crucial for managing distributed workloads.
As you can see in the Serve tab, VLLMService is created with vLLM Inference as part of it, and there are logs in case you need to dive deep into something.
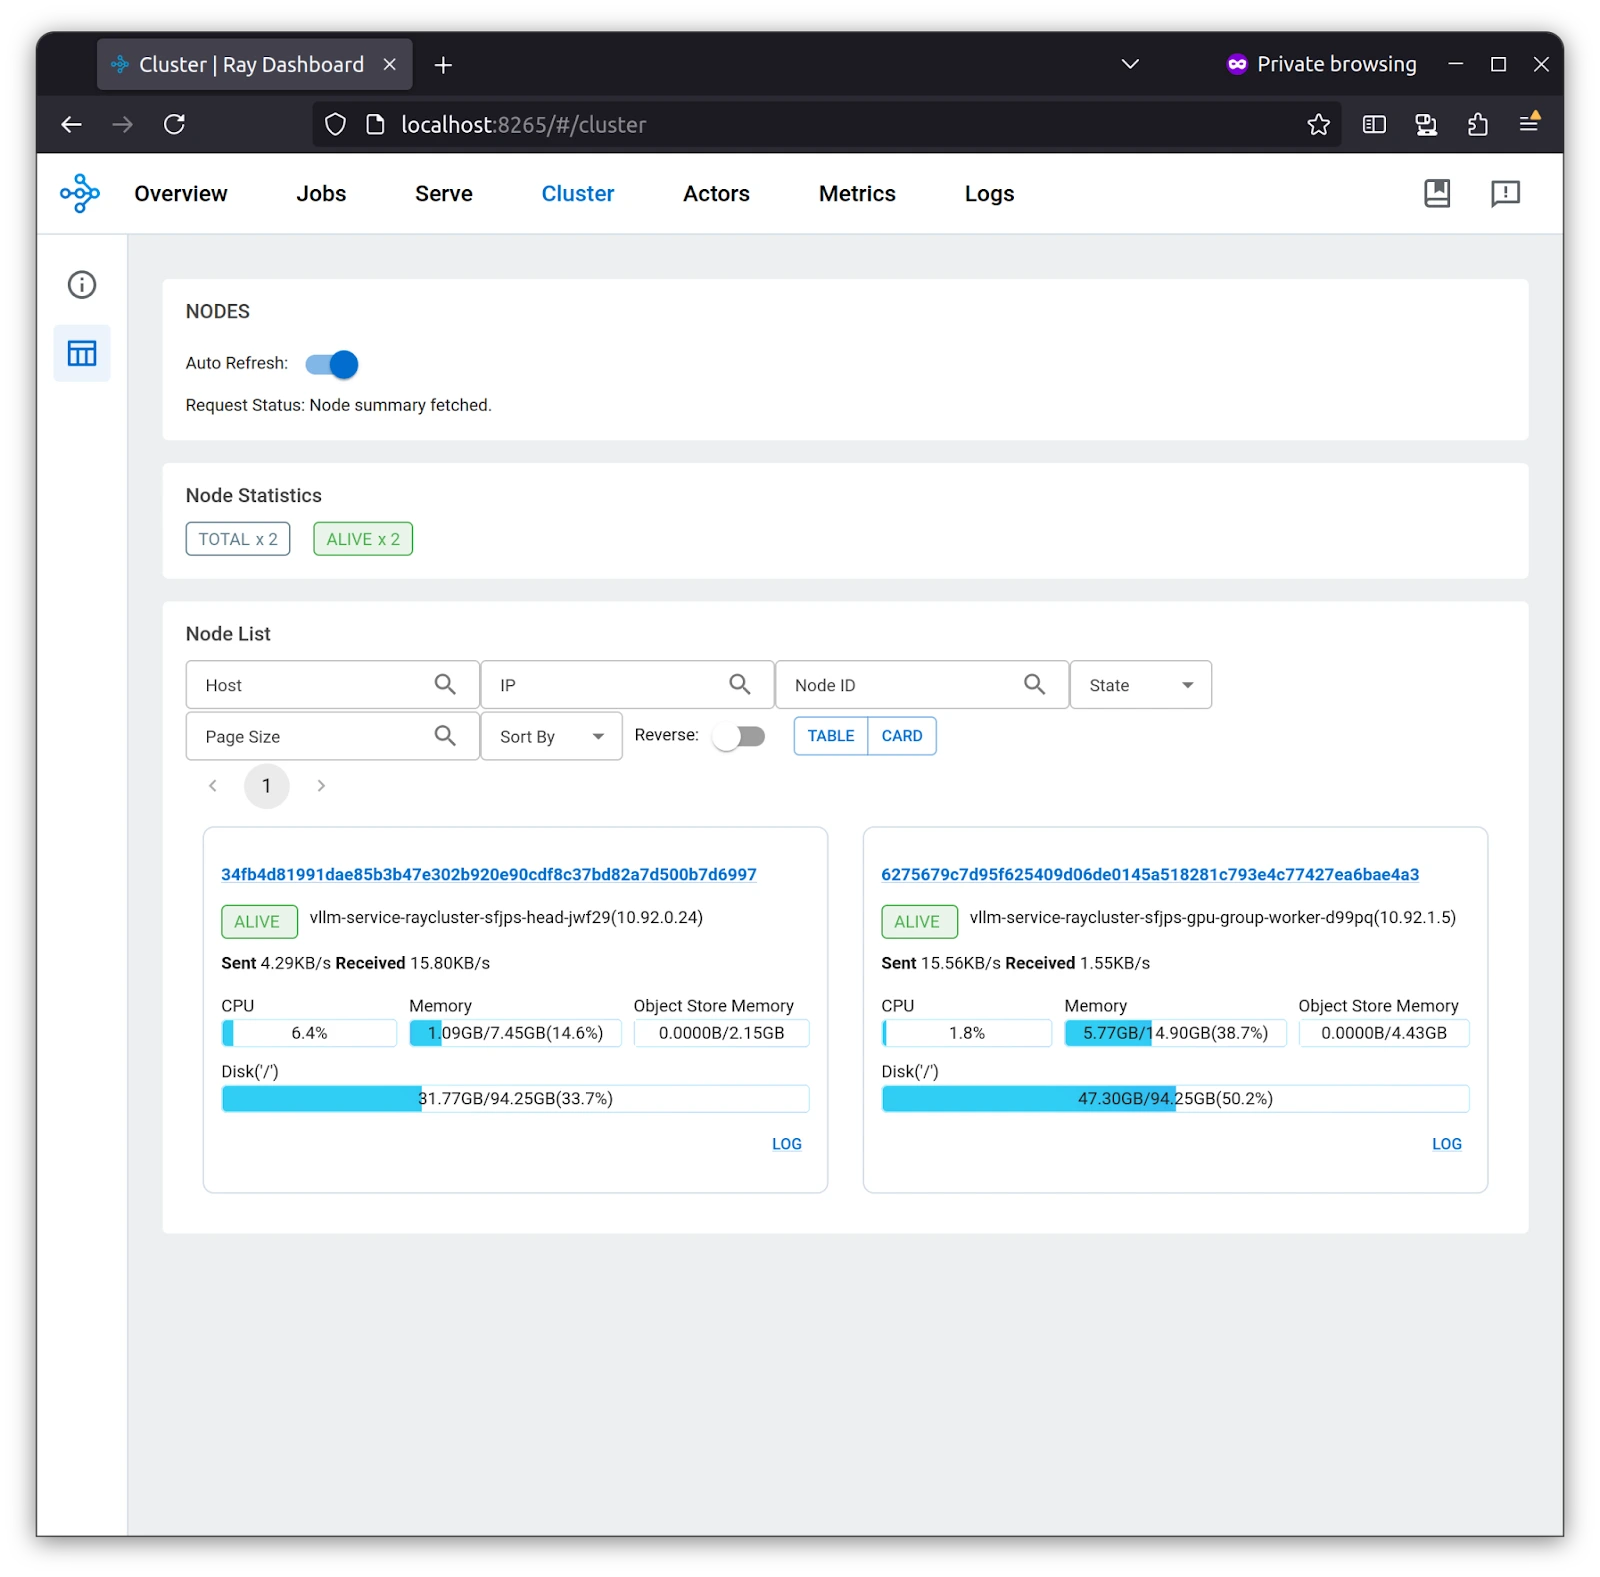
The cluster tab gives you an overview of the cluster, from resource usage to what is causing which resources, once you click on the link to the cluster name. Upon toggling the button from table to card, you can see your memory and GPU resources.
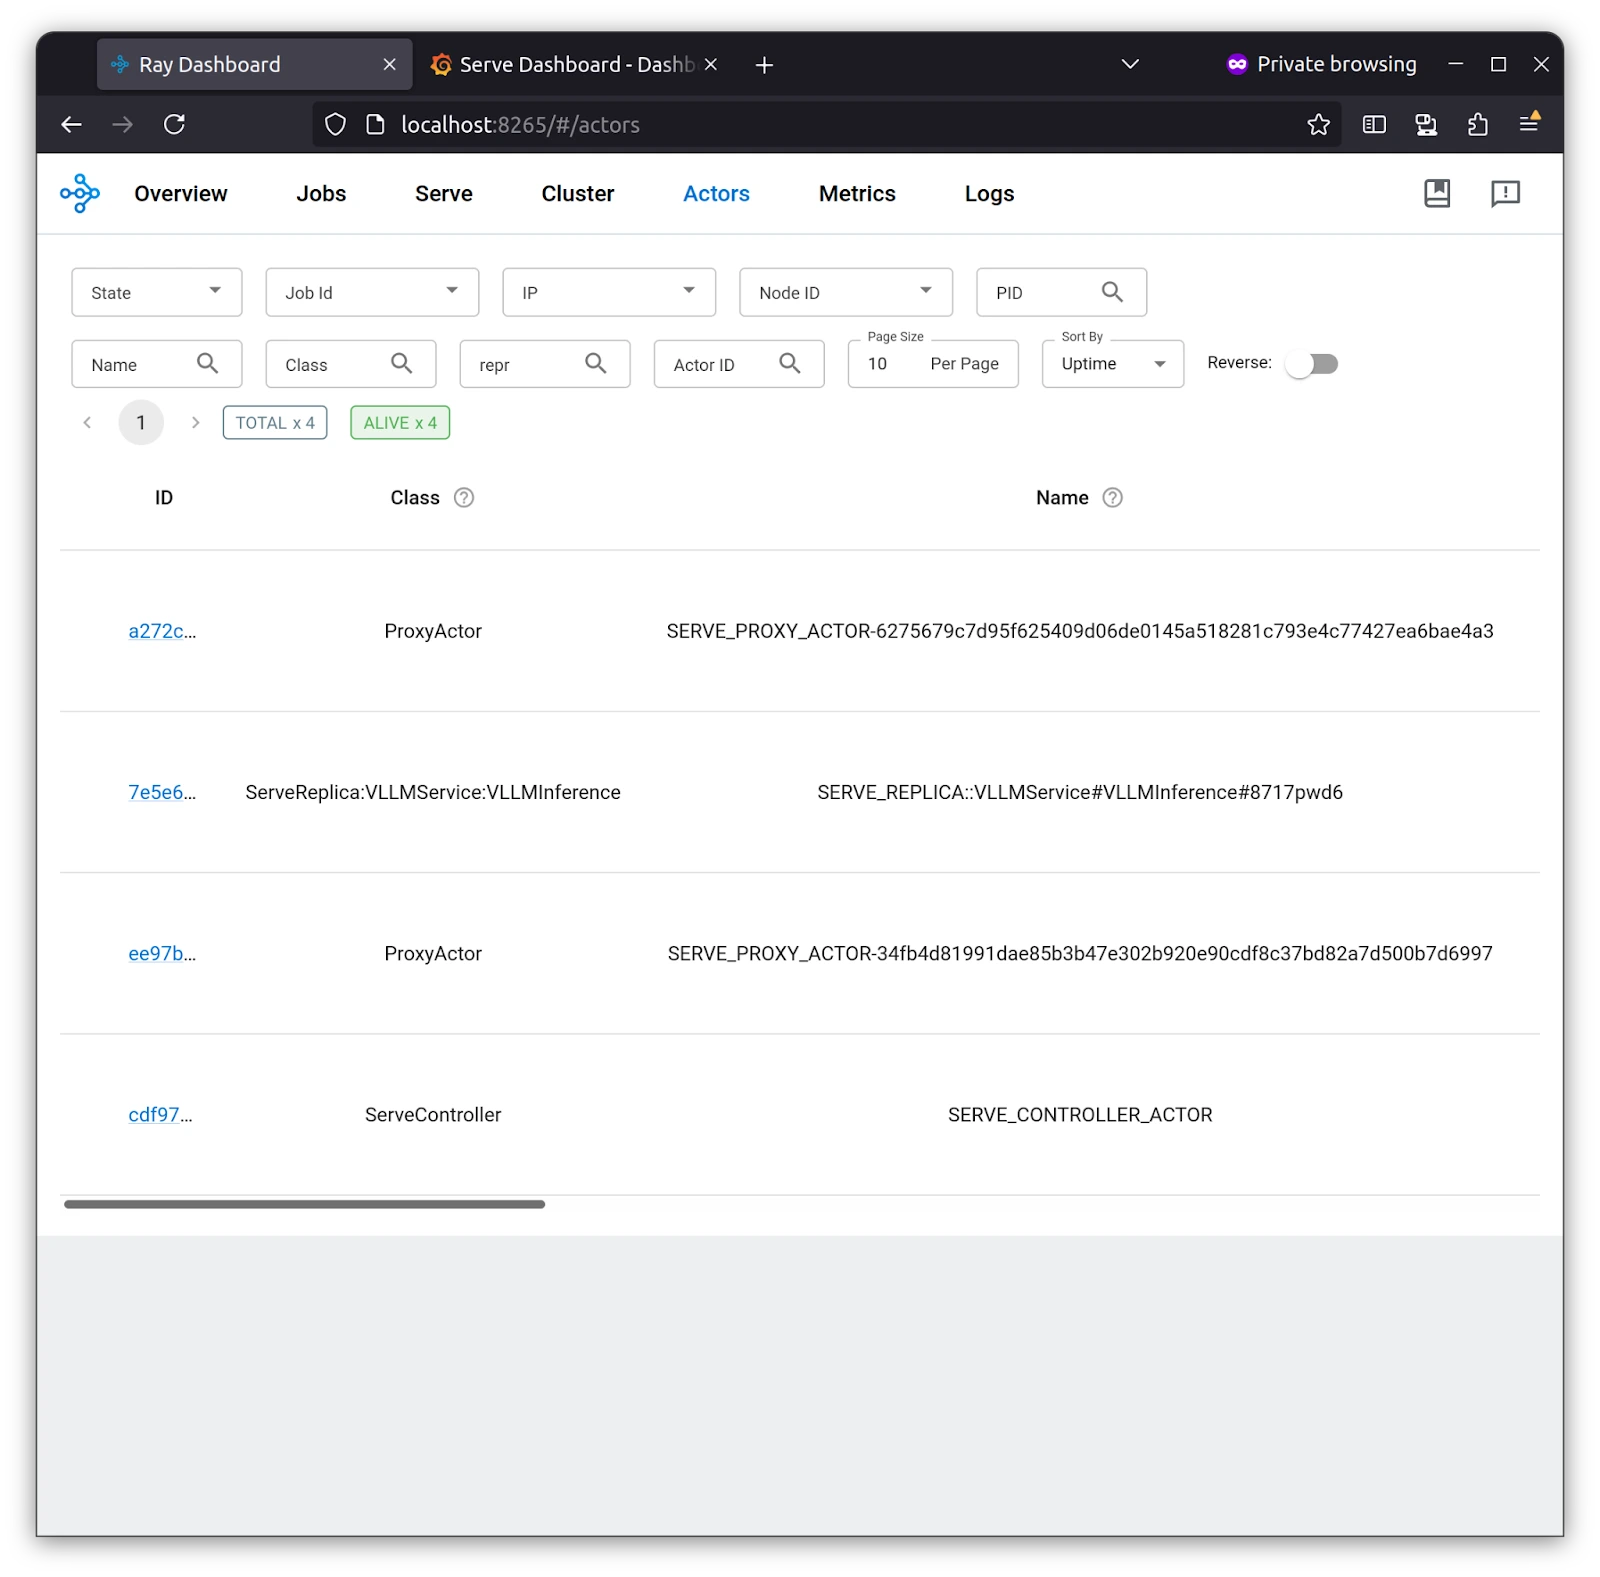
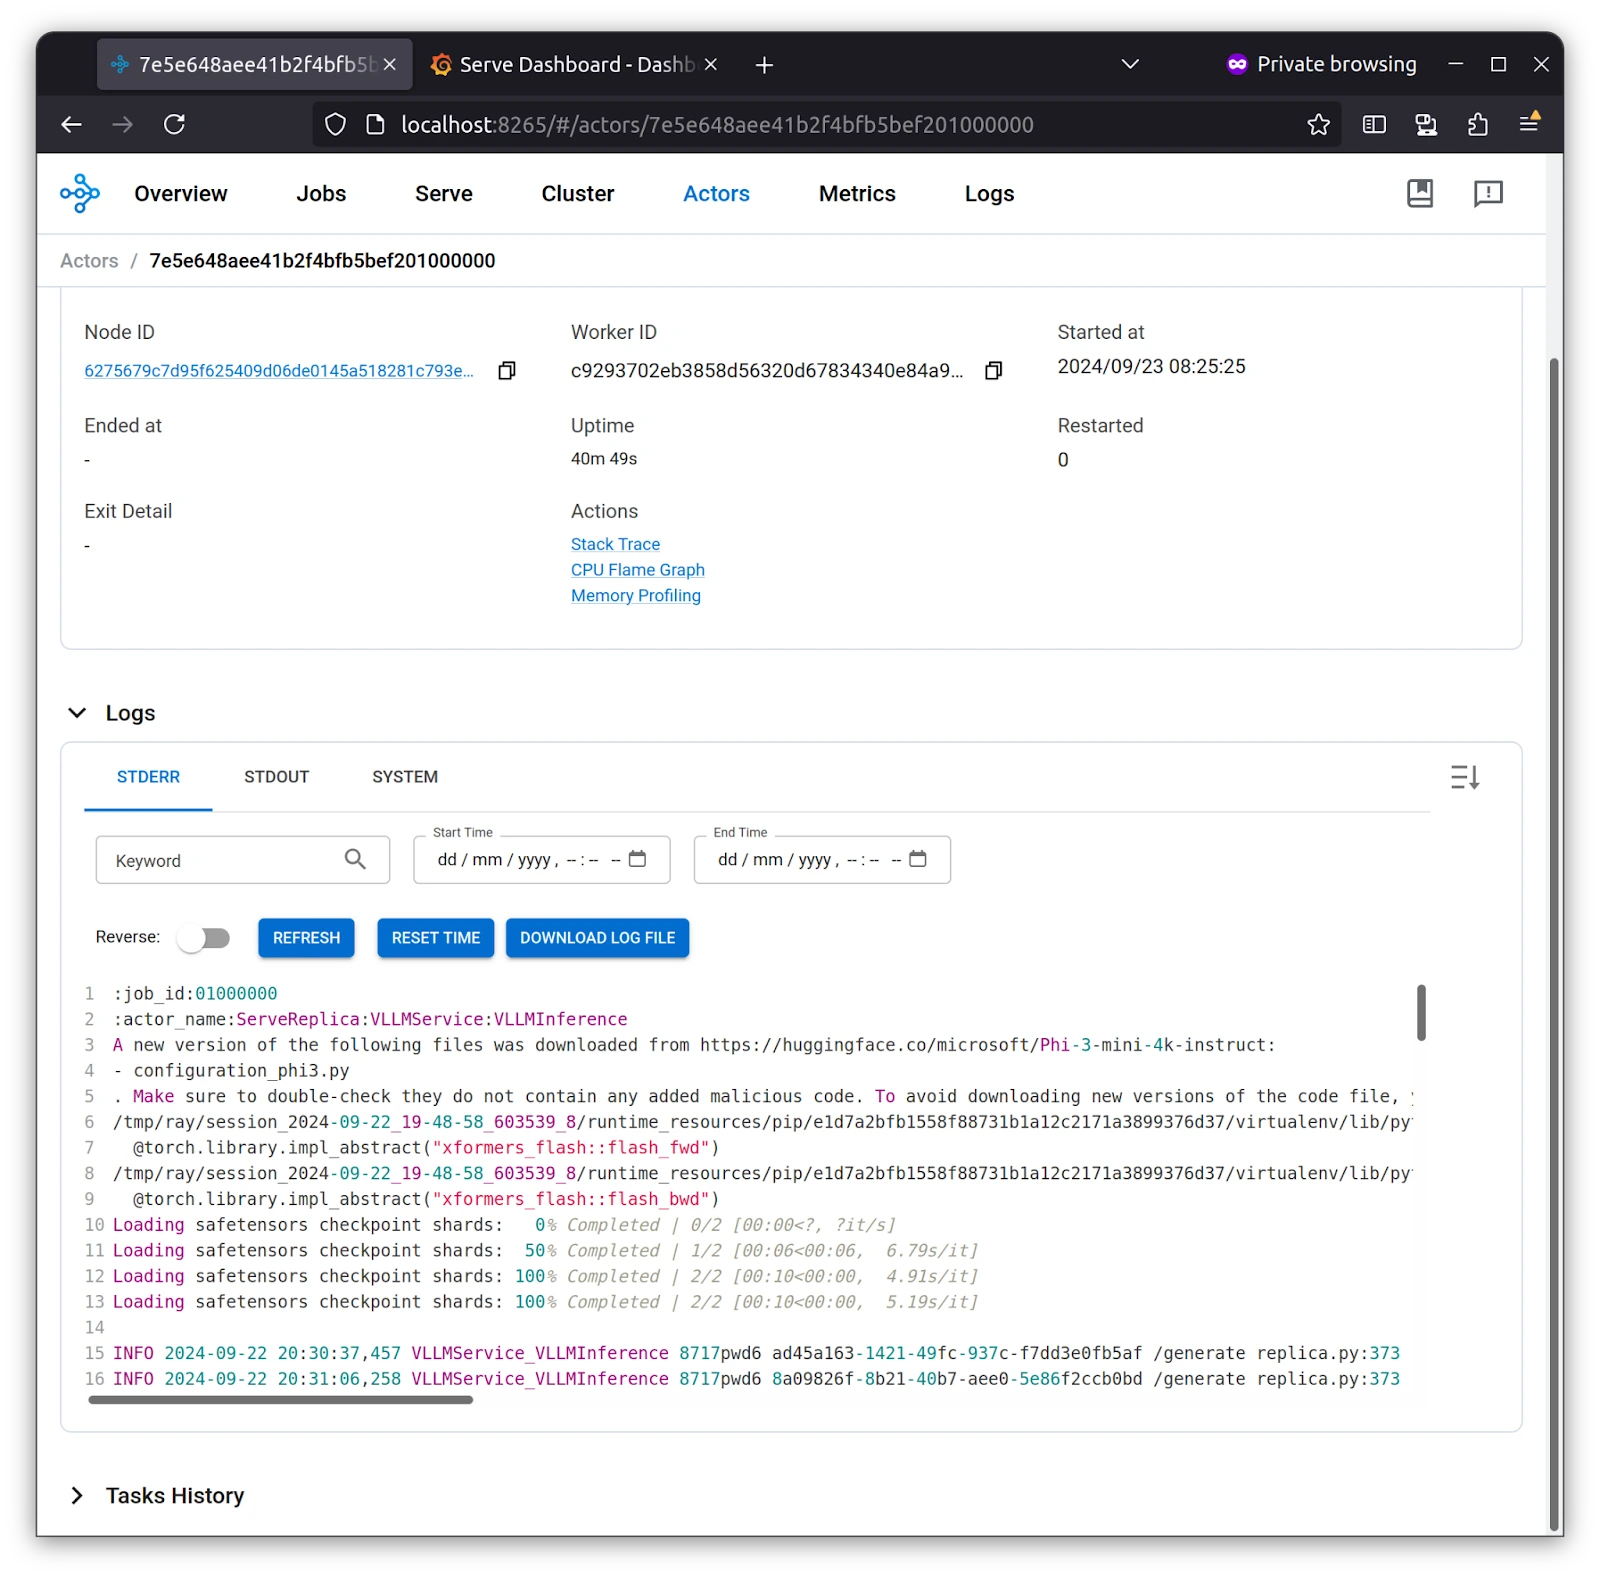
Serve Replica, which we set to 1 for our application, is deployed, and we can see its logs in the Ray Dashboard under Actors. As stated earlier, the stateful unit of work is the Actor.
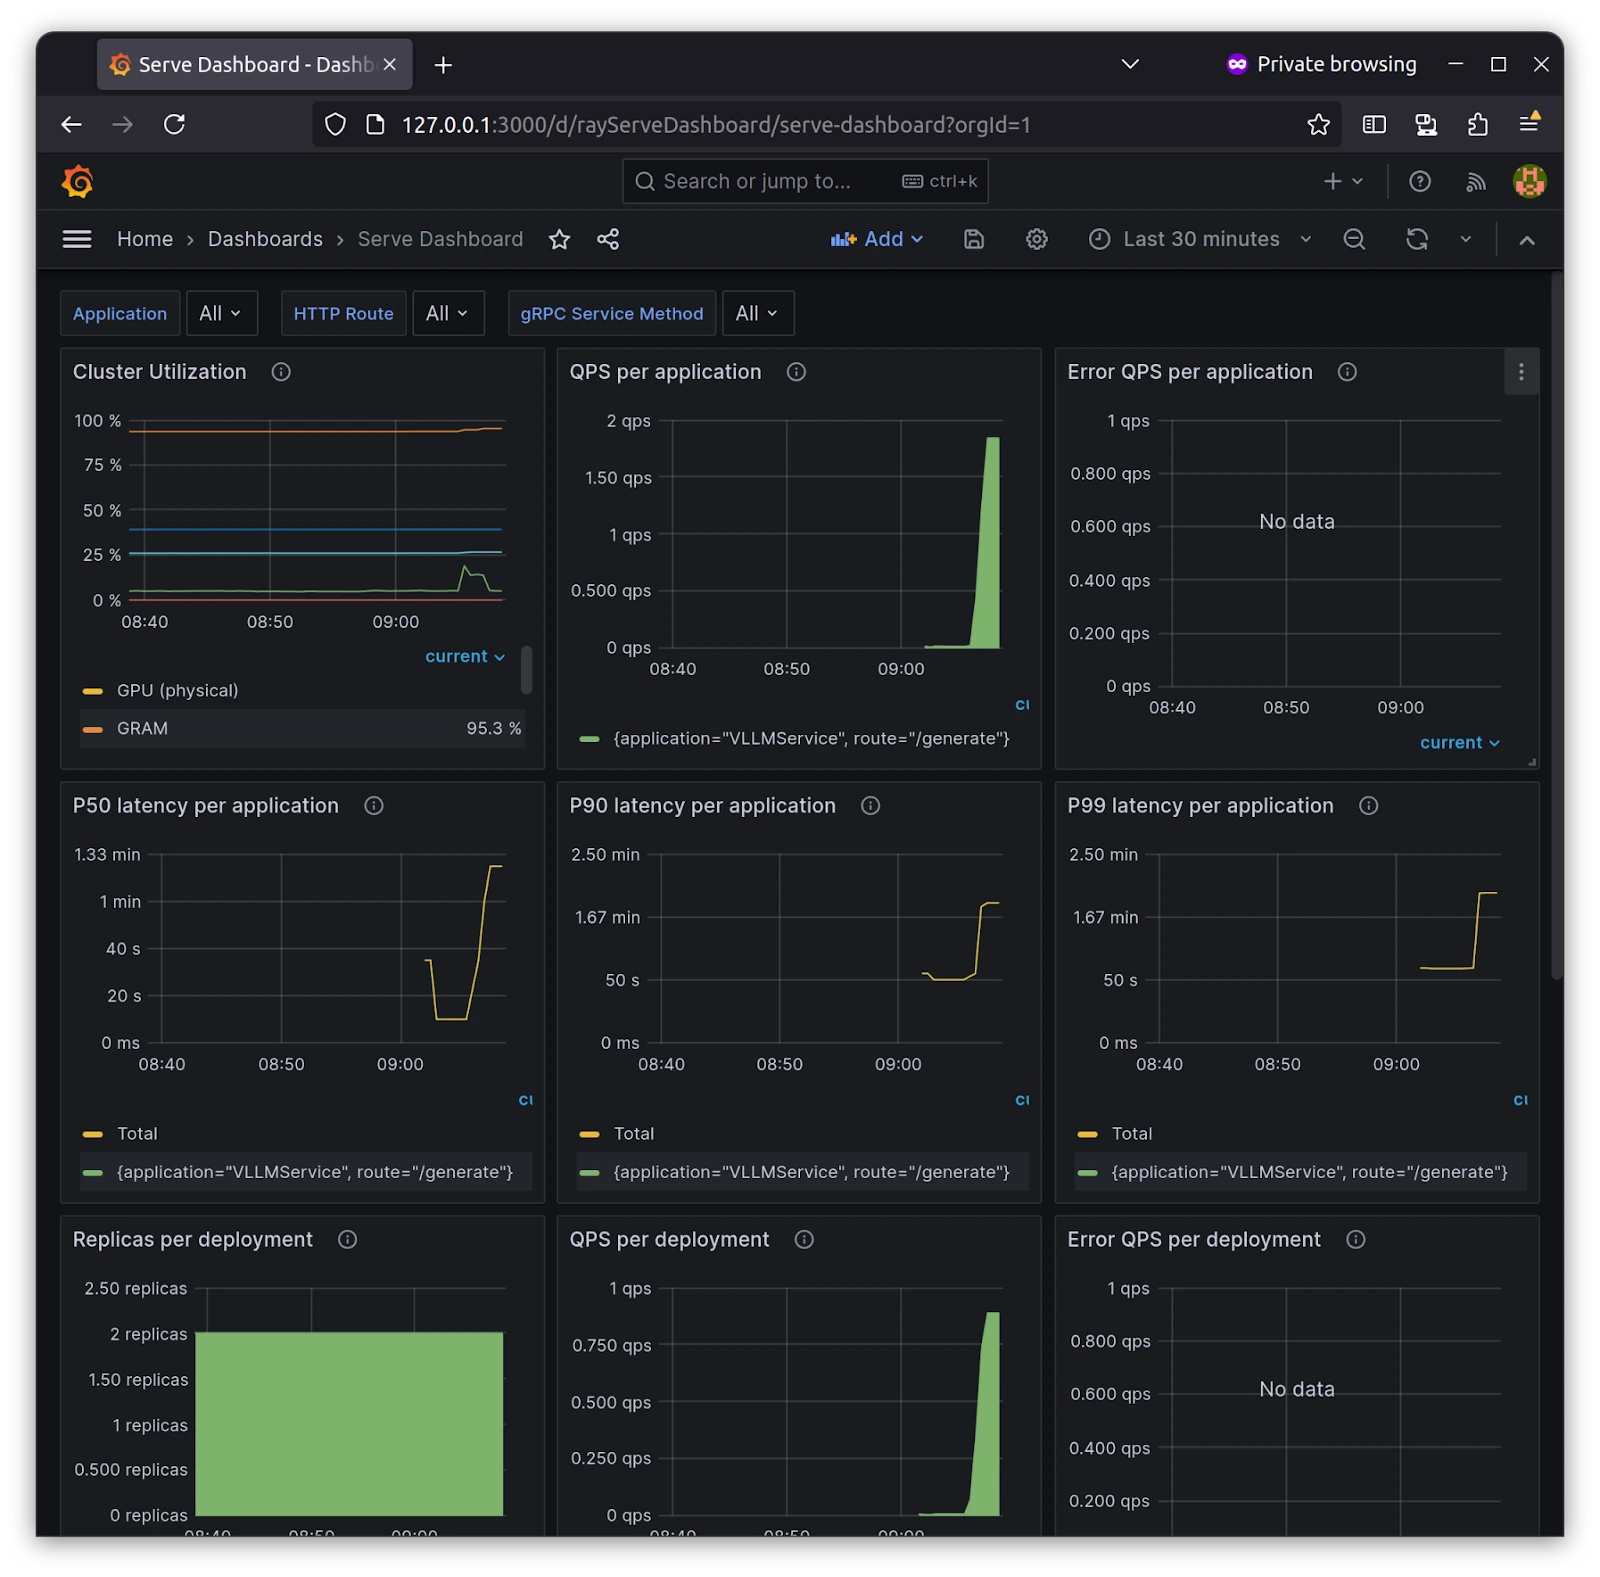
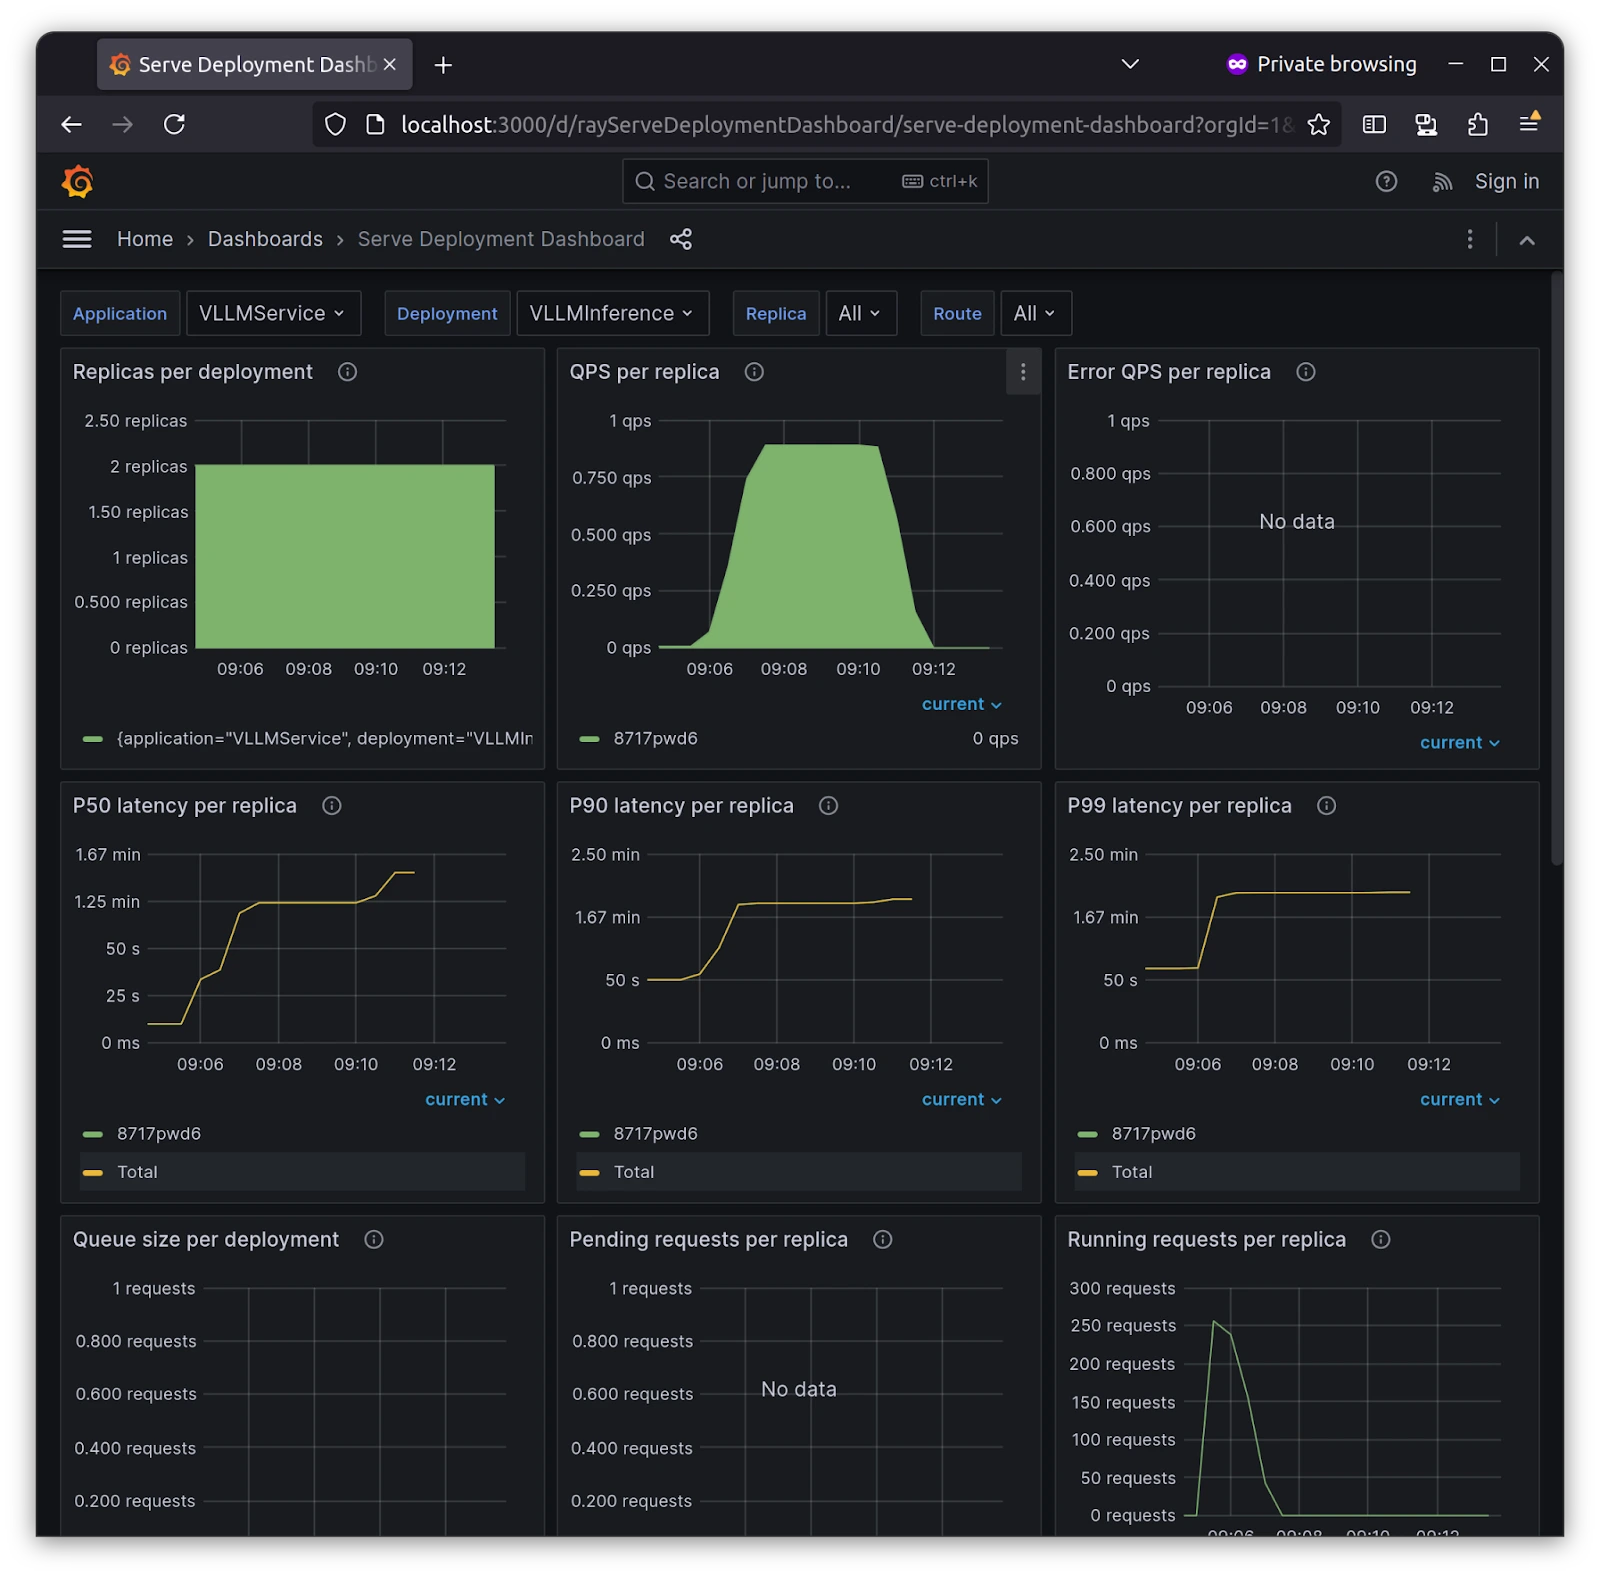
With a monitoring stack
With Grafana and Prometheus in place, you can get more information, such as the QPS( Query Per Second ) of each service and replicas if you have more than one, and an overall view of the deployment we’ve deployed, i.e., VLLM Service. This monitoring setup reduces the burden and provides more than enough metrics for you when you start with Ray on Kubernetes.
This is it! You’ve deployed your model and monitored Ray Cluster running on Kubernetes with KubeRay.
Conclusion
The model serving space is still evolving, but Ray Serve provides a good starting point for anyone looking to serve their model without having to restrict themselves to which inference or training framework/model format to work with. It allows users to choose and deploy any inference library, such as TensorRT, vLLM, etc.
Apart from this, many big companies use the Ray ecosystem to scale and build AI infrastructure. If you’re looking for experts who can help you scale or build your AI infrastructure, reach out to our AI & GPU Cloud experts.
If you found this post valuable and informative, subscribe to our weekly newsletter for more posts like this. I’d love to hear your thoughts on this post, so do start a conversation on LinkedIn.
Read More
Stay updated with latest in AI and Cloud Native tech
We hate 😖 spam as much as you do! You're in a safe company.
Only delivering solid AI & cloud native content.
Posts You Might Like


